
|
Fig. S6
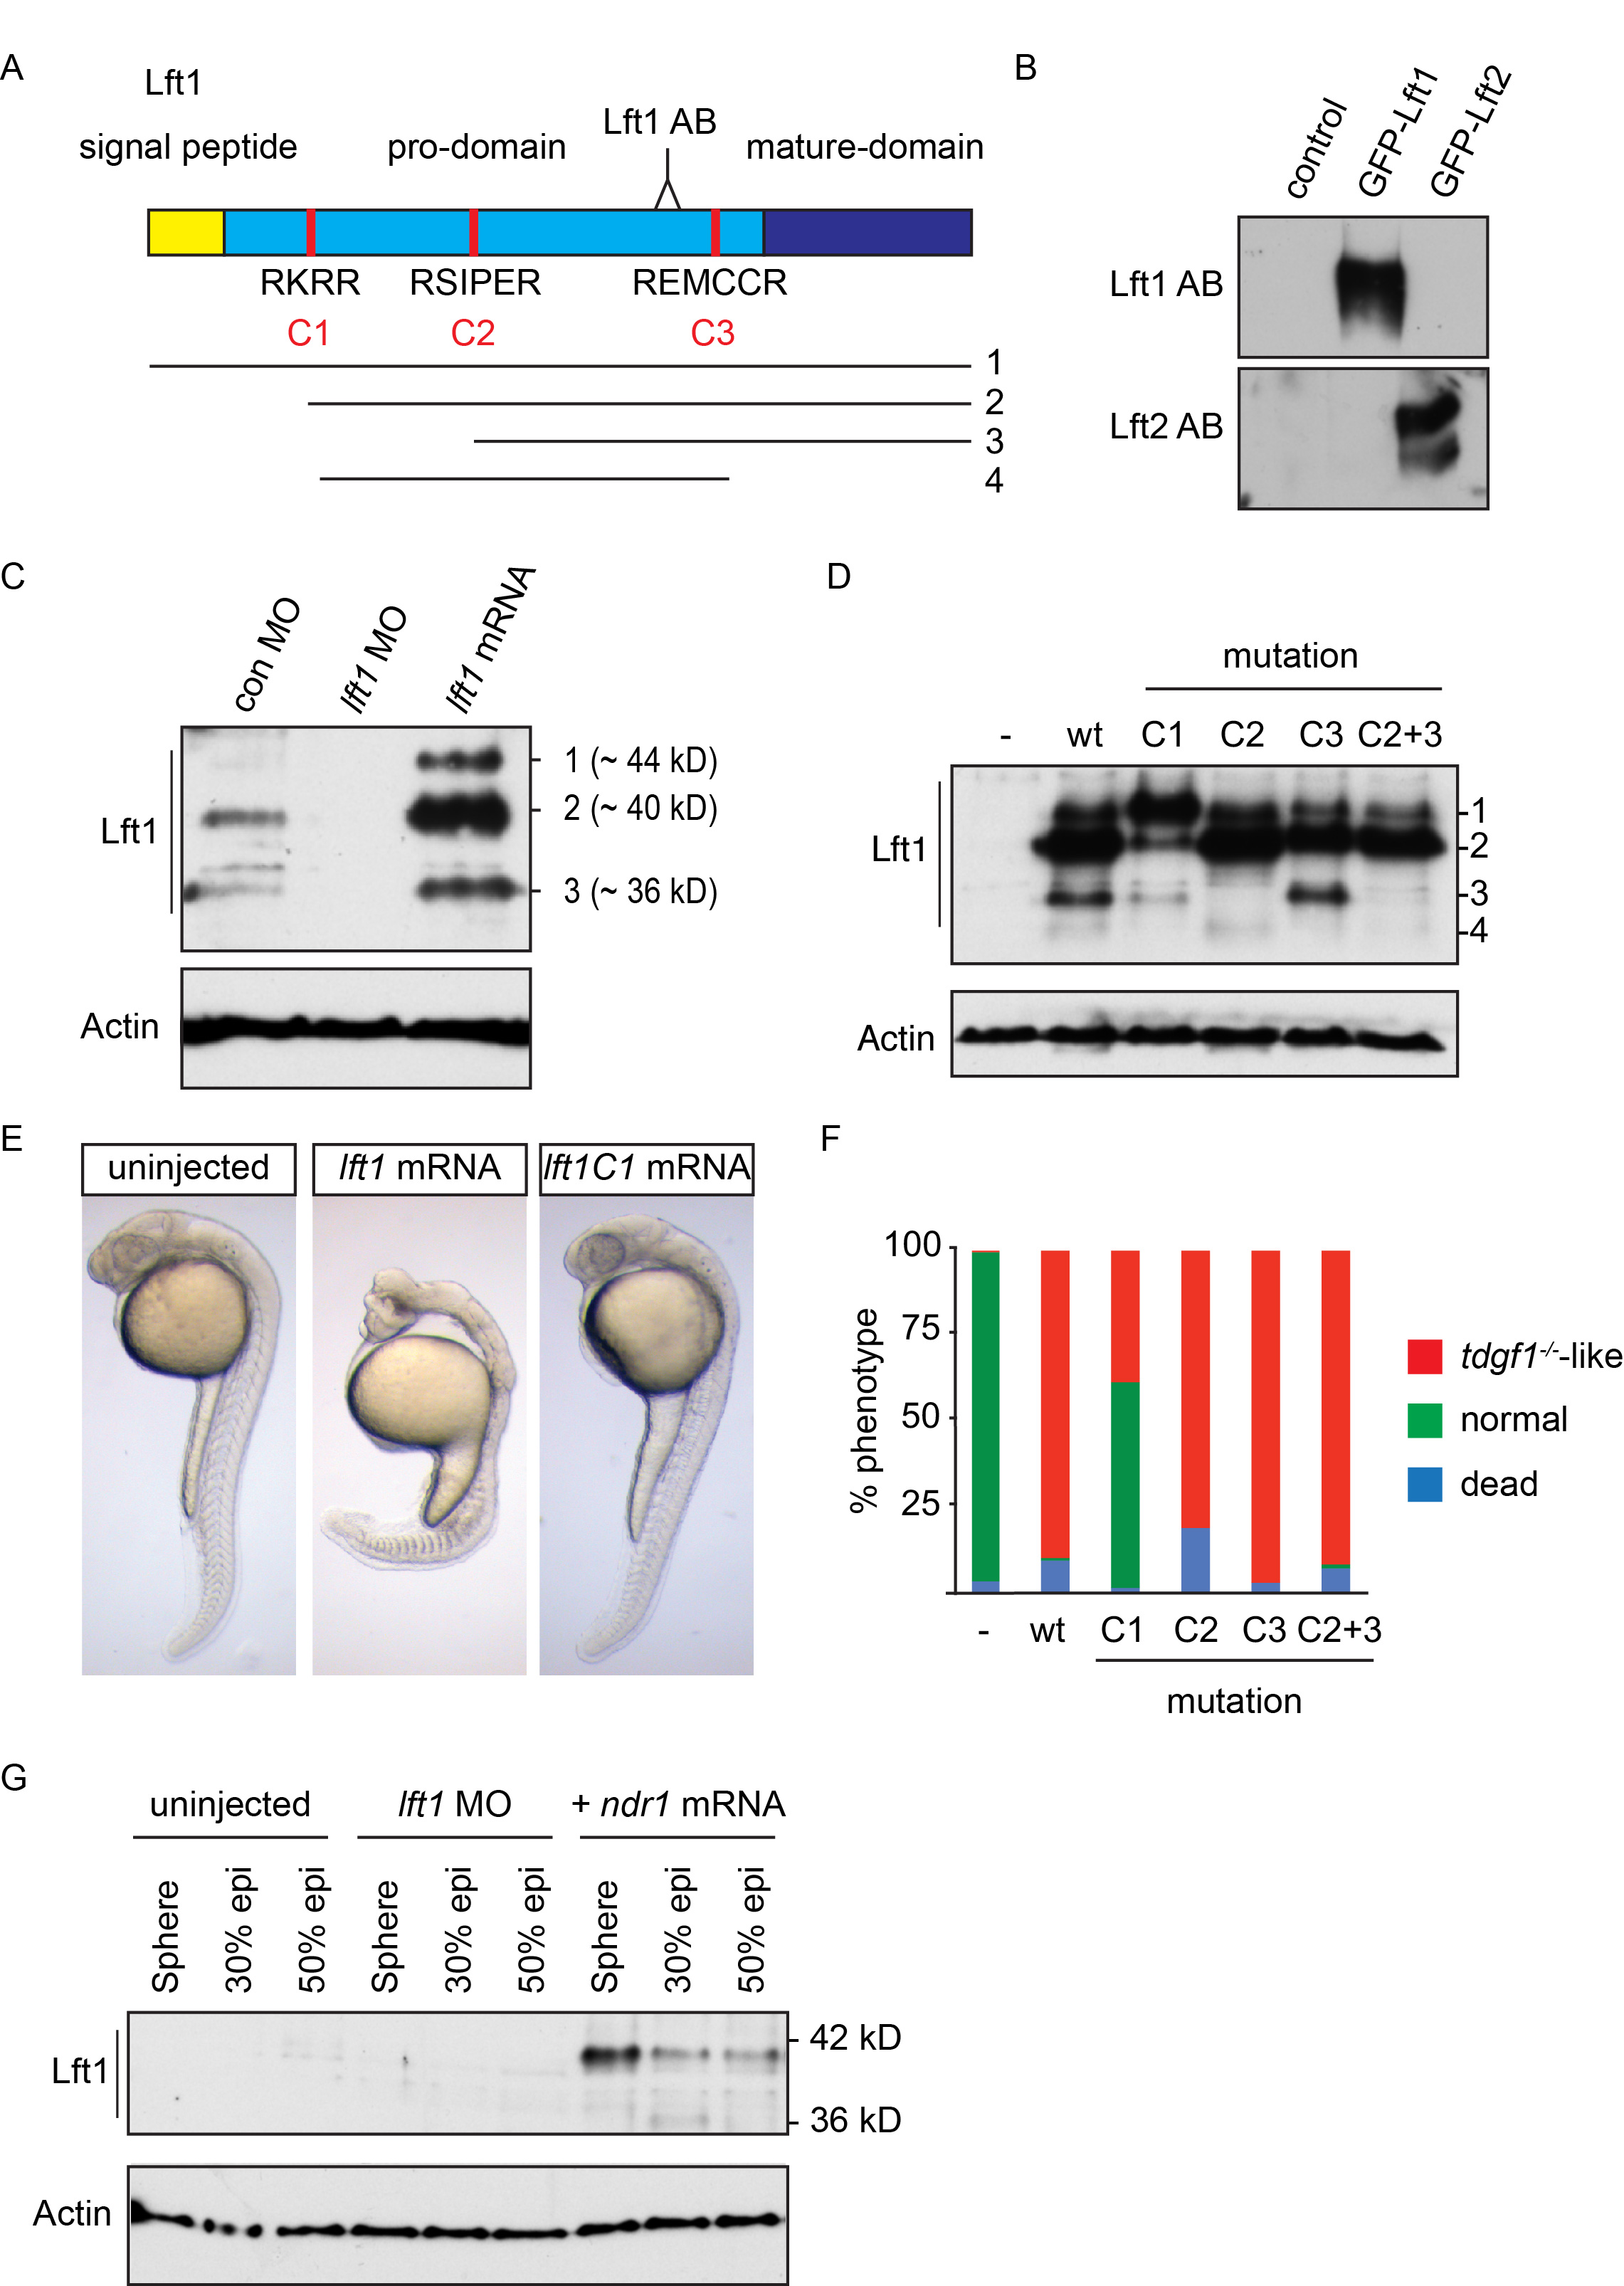
The Lft1 antibody recognizes the 40 kD cleaved and active Lft1 protein
(A) Schematic representation of the zebrafish Lft1 protein. The Lft1 epitope is located in the pro-domain (light blue), just upstream of the mature ligand domain (dark blue). The Lft1 protein contains a signal peptide (gold) and three cleavage sites (C1-C3, red). The cleavage products (1–4) detected by SDS-PAGE are shown. AB, antibody
(B) Western blot for in vitro reticulocyte-translated Lft1 and Lft2 using the cognate antibodies. Note that the Lft1 antibody recognizes GFP-Lft1, but not GFP-Lft2, and vice versa.
(C) Western blot for endogenous and overexpressed Lft1 in pooled 50% epiboly embryo lysates. Overexpressed Lft1 runs as three bands at ~44, ~40, ~36 kD. The second band (~40 kD) corresponds to the main visible endogenous band. These bands are all absent when Lft1 is knocked down using a lft1 MO.
(D) Western blot for wild type (wt) and mutant overexpressed Lft1 proteins in pooled zebrafish embryos. C1-C3 corresponds to mutated cleavage sites depicted in (A). An additional product (4) is seen in this experiment which results from cleavage at C1 and C3. Actin is a loading control. We conclude that the ~40 kD band arises from cleavage at C1.
(E) Phenotype in 24 hpf wt embryos either uninjected or injected with 5 pg lft1 or lft1C1 mutated mRNA. Note that mutating the C1 site leads to rescue of the lft1 phenotype.
(F) Quantification of phenotypes of 24 hpf embryos, injected with 5 pg wild type or mutant lft1 mRNAs. Assays were performed on at least 50 embryos.
(G) Western blot for Lft1 in wild type embryos either uninjected or injected with lft1 MOs or ndr1 mRNA. Note that both the 40 kD and 36 kD bands are visible in ndr1-injected embryos and that the 40 kD band is barely visible in 50% epiboly uninjected embryos.
Reprinted from Developmental Cell, 35, van Boxtel, A.L., Chesebro, J.E., Heliot, C., Ramel, M.C., Stone, R.K., Hill, C.S., A Temporal Window for Signal Activation Dictates the Dimensions of a Nodal Signaling Domain, 175-185, Copyright (2015) with permission from Elsevier. Full text @ Dev. Cell