
|
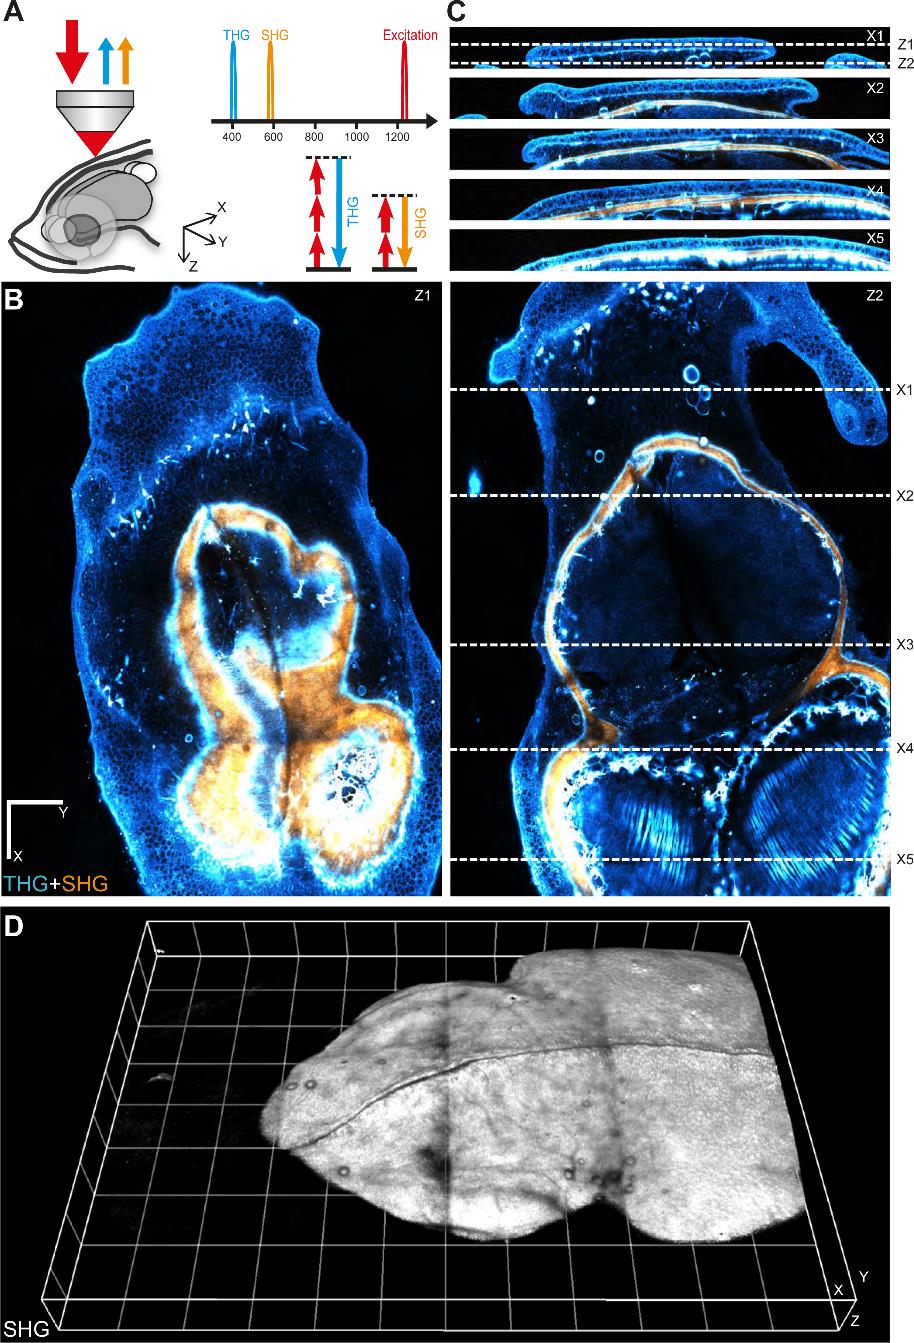
Fig. S3 Second- and third-harmonic generation (SHG, THG) imaging of the telencephalon region in a live zebrafish adult. (A) Imaging geometry and harmonic signals optical properties. The fish (5 months) was anesthetized and held in an upright microscope. Backscattered THG and SHG signals were collected through the excitation objective. X corresponds the antero-posterior (ap) axis, Y corresponds to the left-right (lr) axis, and Z corresponds to the dorso-ventral (dv) axis. (B) Two XY images extracted from a dataset encompassing a 2380*1708*160 µm3 volume. (C) Four YZ images extracted from the same dataset. The entire dataset consists of a mosaic of 12 XYZ stacks acquired with 500µm lateral steps, each spanning a volume of 800*800*180 µm3. The global image was assembled from the raw XYZ stacks using FIJI grid stitching module. Excitation wavelength was λ=1180nm. THG signals (at λ/3) and SHG signals (at λ/2) were simultaneously detected on two independent channels. The SHG image, shown in orange, highlights fibrillar collagen and reveals the global structure of the skull. The THG image, shown in blue, highlights interfaces and heterogeneities and provides multiple structural details. In particular, THG signals reveal skin cell boundaries, blood vessels, pigmented cells, skull surface, lipidic accumulations, and myelin fibers. Scale bar, 200 µm. Voxel size 2 × 2 × 2 µm3. Time per pixel 5µs. (D) 3D rendering of the SHG data, revealing skull structure. Grid size, 200 µm. 3D rendering was calculated using Imaris (Bitplane). See also Supplementary material Movies 1, 2 and 3.