
|
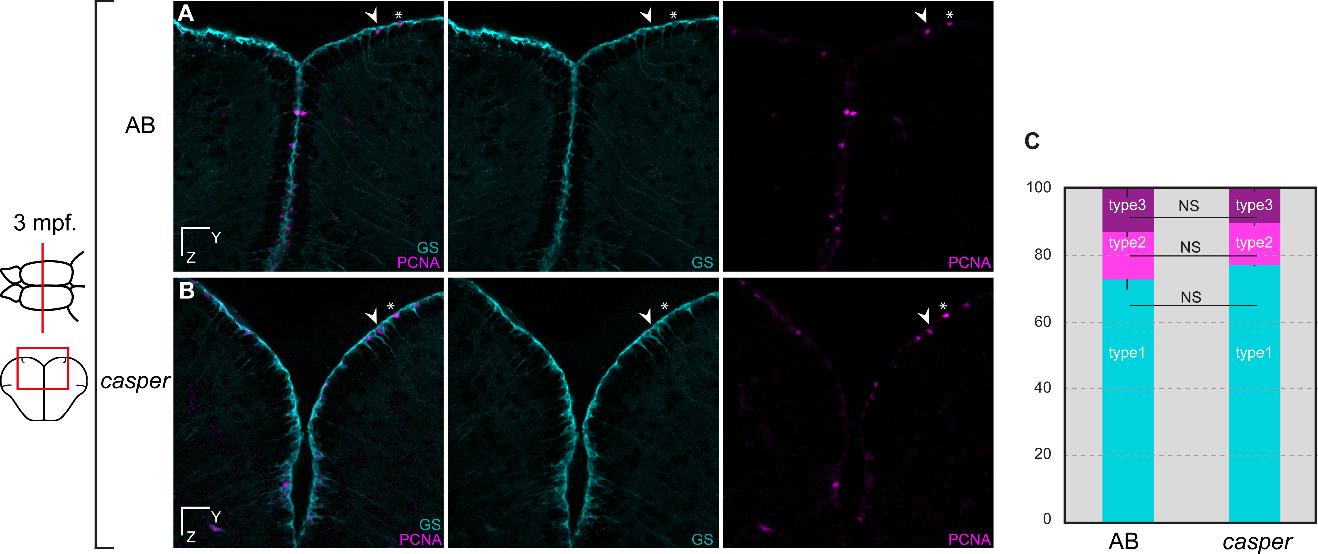
Fig. S1 Adult casper fish1 display a normal profile of telencephalic neural progenitors. (A,B) Cross-sections of the telencephalon and immunostaining for the glial marker GS (cyan) and the proliferation marker PCNA (magenta) in the pallium of 3 month-old (mpf) (A) wild type AB and (B) casper (double homozygote for roy-/-;nacre-/-) zebrafish. (C) Quantification of non-dividing RG (type1 cells), dividing RG (type2 cells) (arrowhead) and dividing non-RG (type3 cells) (asterisk) progenitors showing no statistical differences between the two genotypes (unpaired t-test comparing the proportion of each cell type between AB and casper, P values > 0.05) (unpaired t-test for type1 cells: P value = 0.0821; for type 2 cells: P value = 0.1477; for type 3 cells: P value = 0.0974). n = 4 brains each with 3 to 6 sections per brain. Scale bars: 30 µm (A,B)