
|
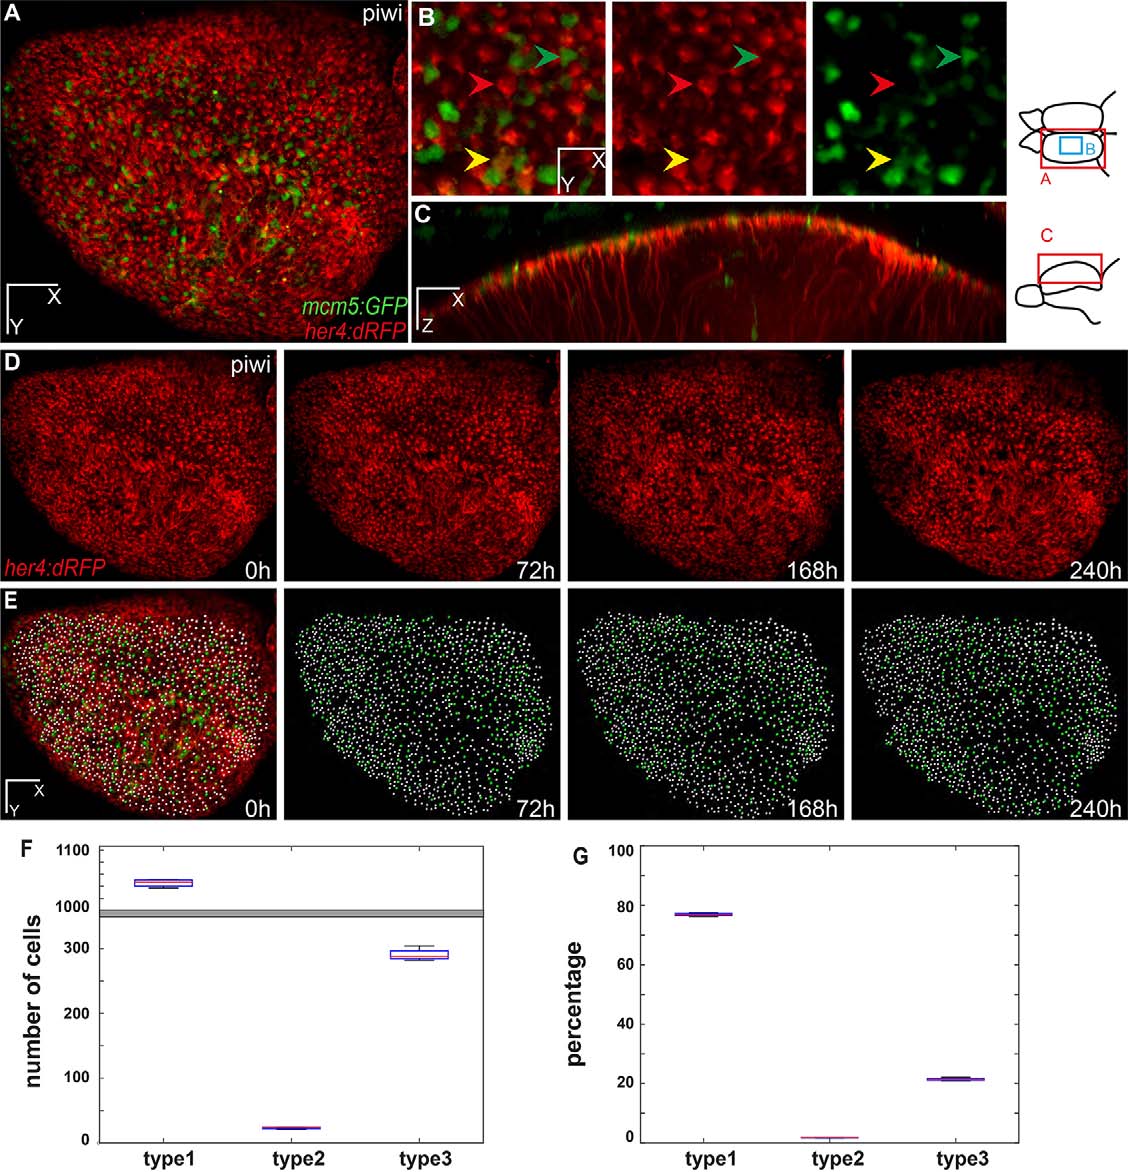
Fig. 2
Live imaging and tracking over 10days of all adult neural stem cells across the entire pallial germinal zone. (A-C) One hemisphere of a her4:dRFP;mcm5:eGFP;casper transgenic fish (individual fish named piwi) imaged through the skin and skull. Anterior to the left. (A) Dorsal view of an entire hemisphere. (B) High magnification of a central area of the medial pallium, observed live, highlighting examples of quiescent RG (type 1), proliferating RG (type 2) and proliferating non-glial progenitors (type 3 cells) (red, yellow and green arrowheads, respectively). (C) Optical sagittal section showing the processes of the glial cells through the parenchyma. Diagrams to the right show the regions imaged for A,B and C. (D,E) Dorsal views of the pallial germinal zone in the same animal after alignment over 10days of imaging. (D) Red channel highlighting all RG cells. (E) RG cells (white dots; 1122 cells on average, s.d.=13) and proliferating cells (green dots; 290 cells on average, s.d.=9) plotted over time across the entire germinal zone (superimposed to the fluorescence image on the left panel). (F,G) Box plot of the total number (F) and percentage (G) of progenitor cells of each type, averaged over the different time points of imaging. The mean number of type 1 cells counted is 1042 (s.d.=7.6), of type 2 cells is 91 (s.d.=6.6) and of type 3 cells is 391 (s.d.=9.5). The percentages of type 1, 2 and 3 cells over all cells (type 1+2+3) are 73.5%, 5.7% and 20.6%, respectively. Scale bars: 80µm (A,D,E), 30µm (B), 50µm (C).