
|
Fig. 4, S1
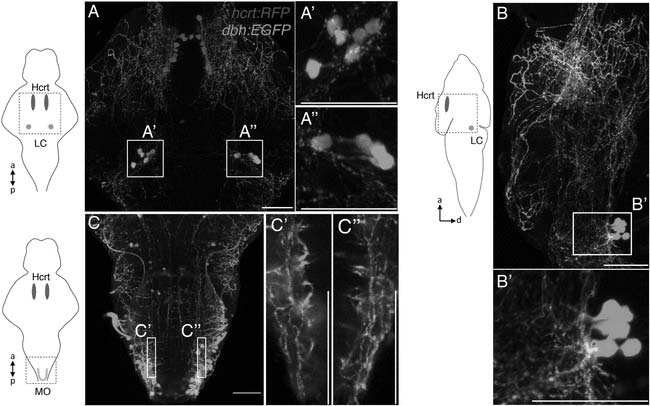
Hcrt neurons project to dbh expressing cells.
Hcrt neurons (red) project to dbh expressing cells (green) in the LC. (A) Dorsal-ventral maximum intensity projection, (B) lateral maximal intensity projection (dorsal to the right). Boxed regions are shown at higher magnification in (A′, A′′, B2). (C) Projections from Hcrt neurons to dbh-expressing neurons in the medulla oblongata (MO). A dorsal-ventral maximum intensity projection is shown. Single optical sections of the boxed regions are shown at higher magnification in (C′, C′′). Schematic diagrams indicate brain regions shown in the confocal images. a = anterior, p = posterior, d = dorsal. Scale bars = 50 µm.