
Image
|
Figure Caption
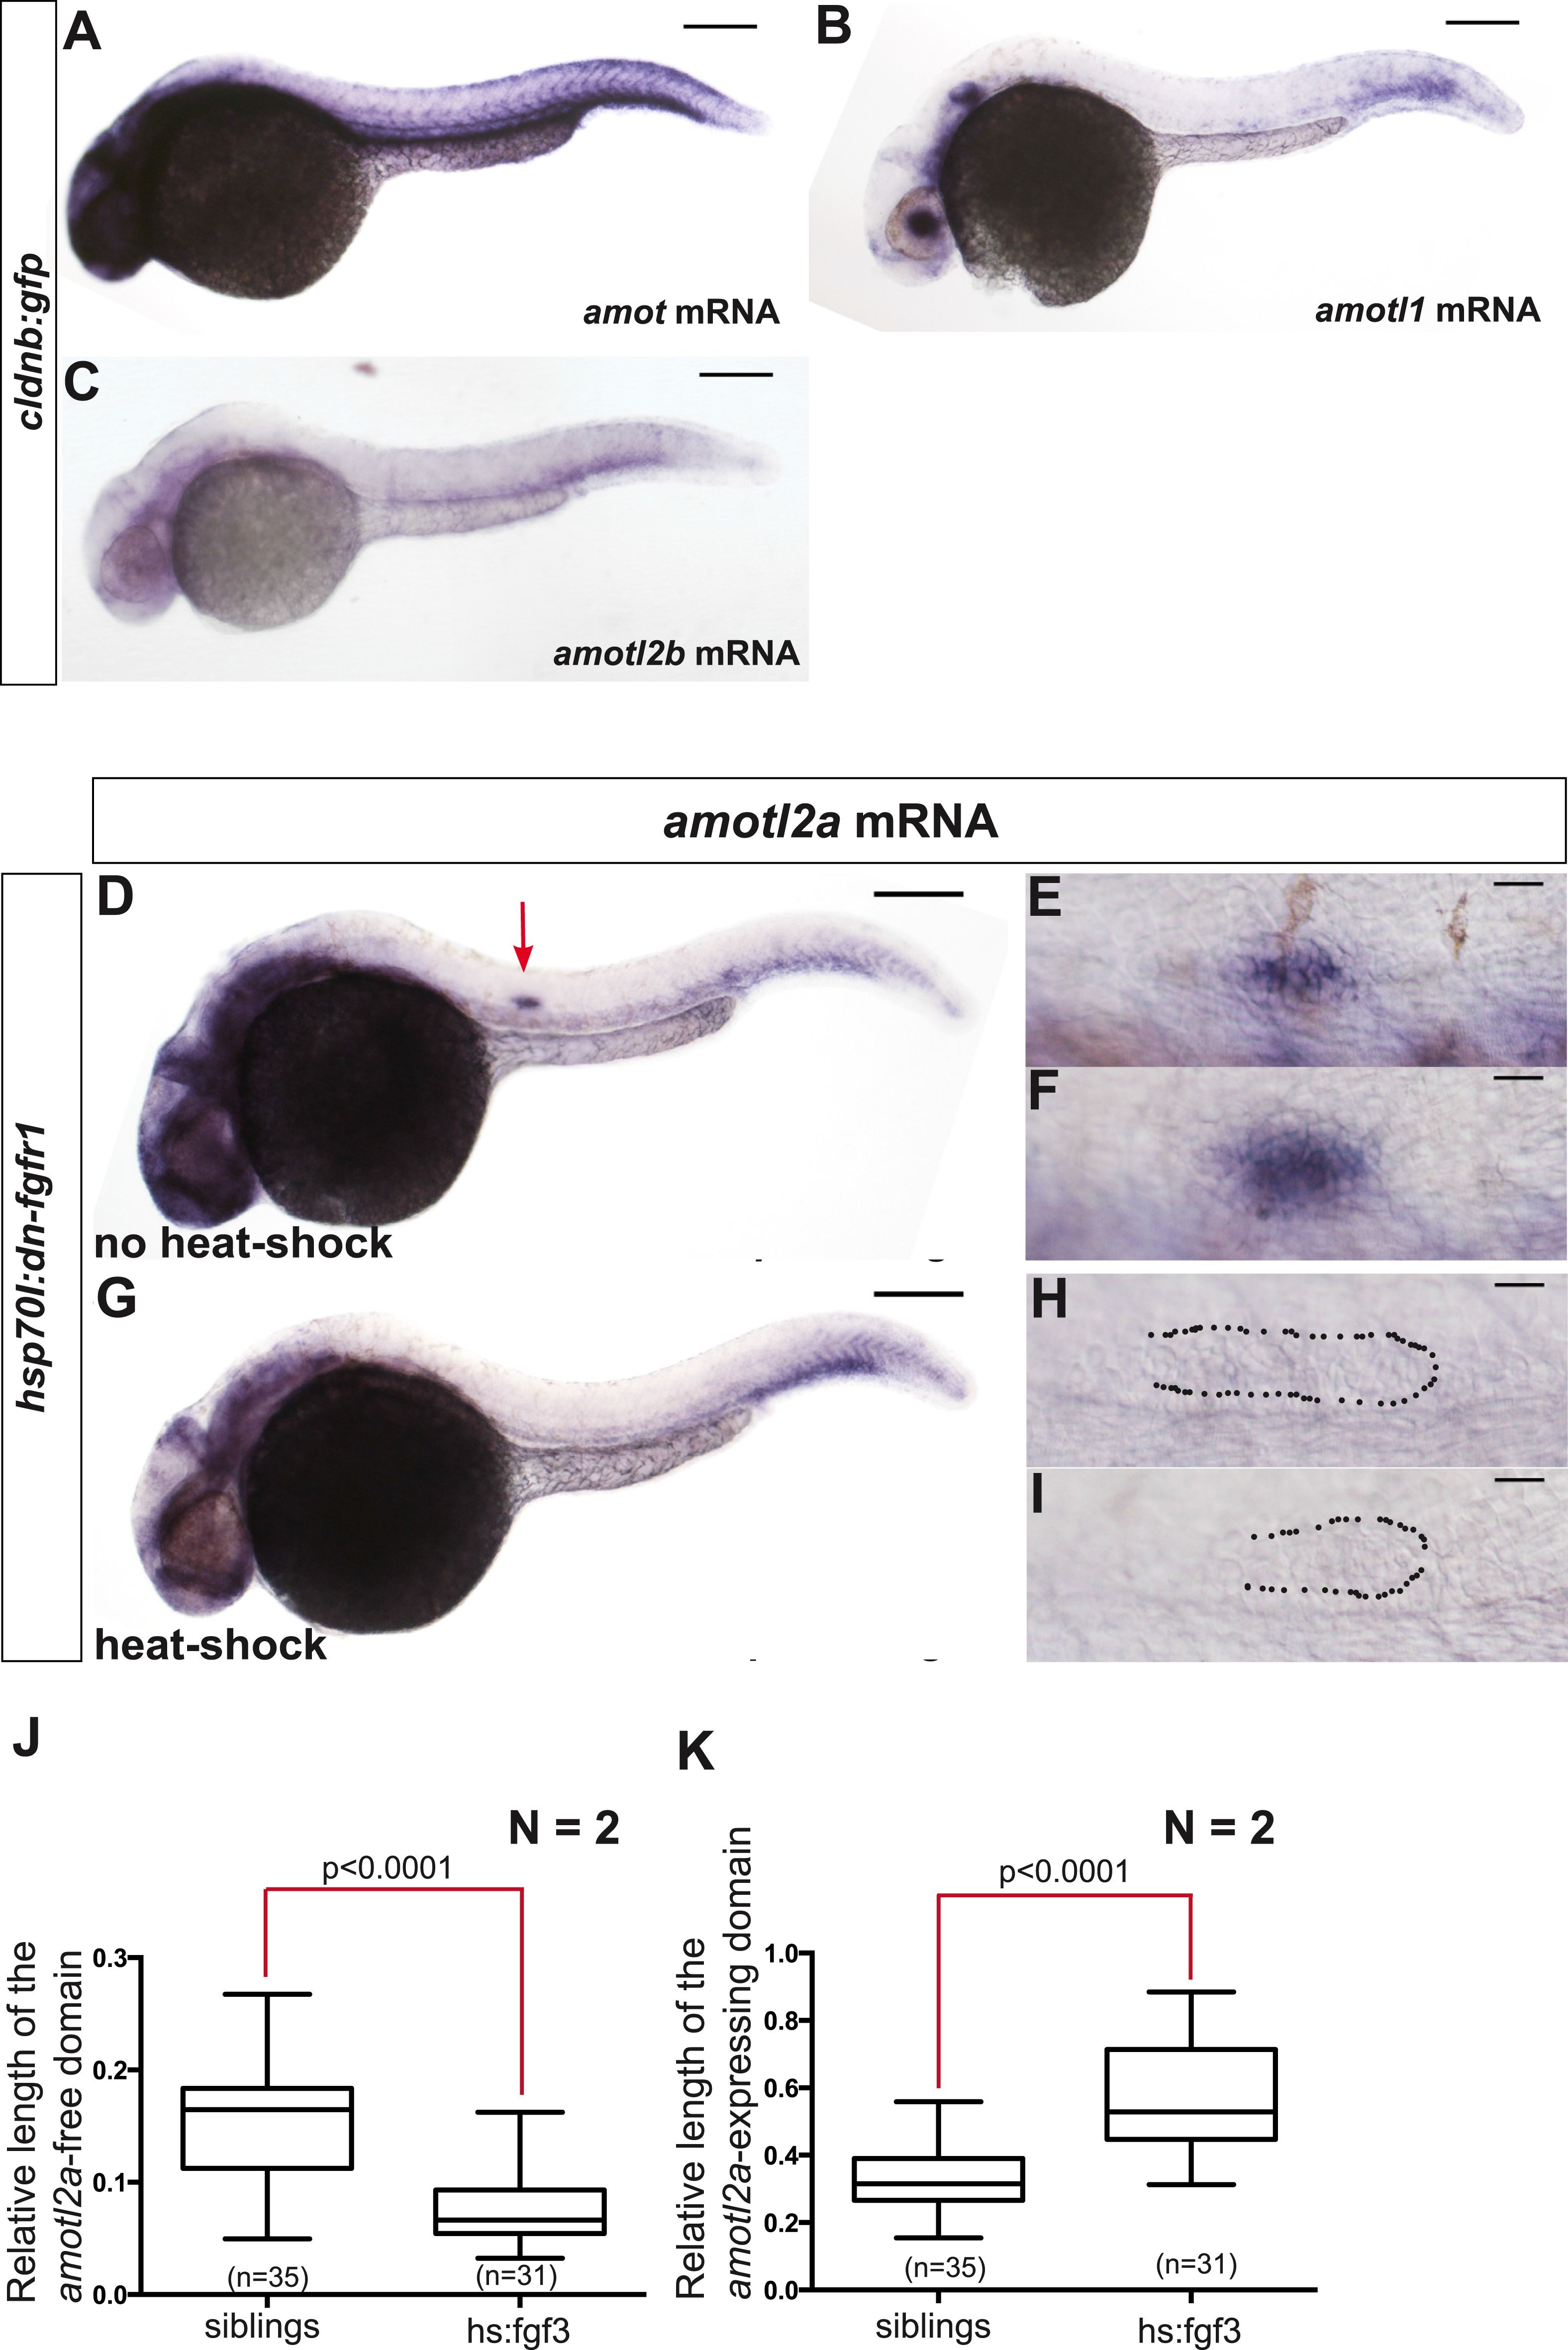
Fig. 1, S1 Only amotl2a is expressed in the pLLP and its expression is controlled by FGF signaling.
(A–C) ISH staining with probes against amot (A), amotl1 (B), and amotl2b (C) in cldnb:gfp embryos. (D–I) ISH staining with an amotl2a probe in Tg(hsp70l:dnfgfr1EGFP)pdl embryos non-heat-shocked (D–F) or heat-shocked (G–I). The red arrow points to the pLLP. The dotted lines indicate the pLLP contour. (J, K) Boxplots showing the comparison of the relative length of the amotl2a-free domain (J) and of the amotl2a-expressing domain (K) between the indicated groups (Figure 1—source data 1).
Acknowledgments
This image is the copyrighted work of the attributed author or publisher, and
ZFIN has permission only to display this image to its users.
Additional permissions should be obtained from the applicable author or publisher of the image.
Full text @ Elife