
Image
|
Figure Caption
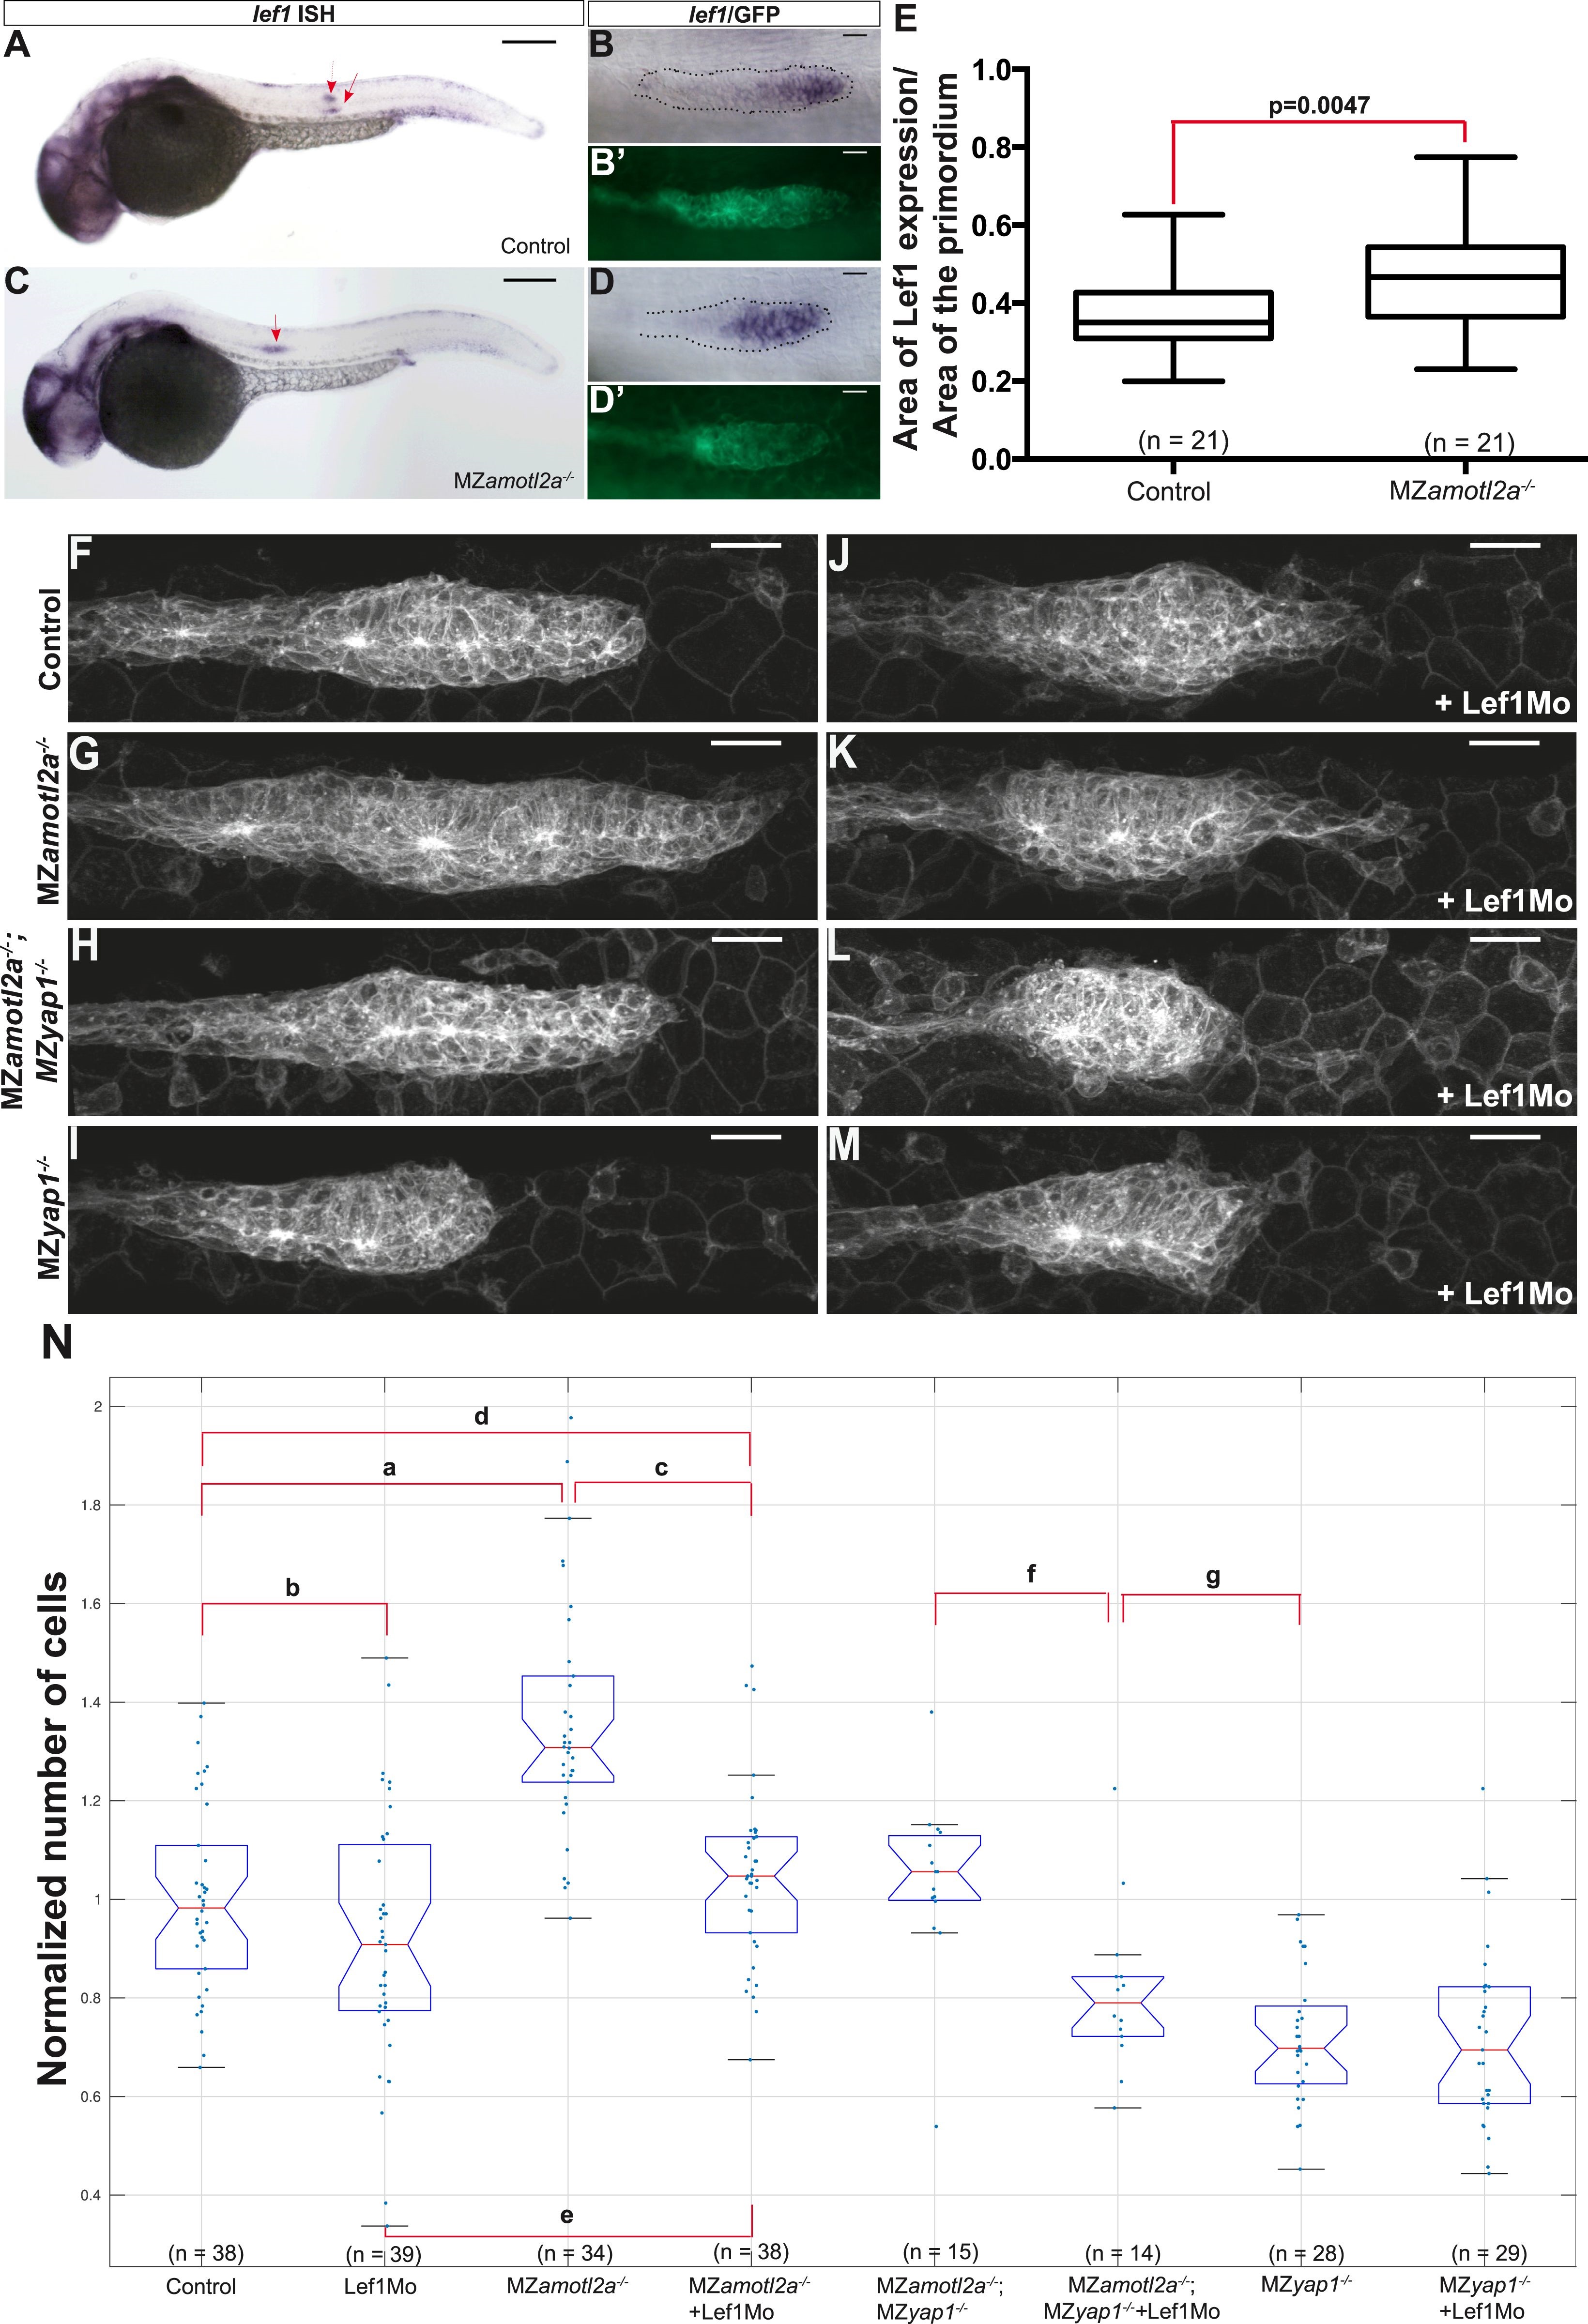
Fig. 7 Loss of Lef1 suppresses the increased cell proliferation in amotl2a mutants.
(A–D2) 30 hpf cldnb:gfp embryos with the indicated genetic background stained with a lef1 ISH probe and an anti-GFP antibody (B2, D′). (E) Boxplot showing the expansion of lef1 expression domain in MZamotl2a-/- embryos. (F–M) MIP of Z-stacks of pLLP in cldnb:gfp embryos with the indicated genotype, either uninjected (F–I) or injected with a Lef1Mo (J–M). (N) Corresponding boxplot comparing pLLP cell counts (Figure 7—source data 1, 2; Figure 7—figure supplement 1, Figure 7—source data 3).
Figure Data
Acknowledgments
This image is the copyrighted work of the attributed author or publisher, and
ZFIN has permission only to display this image to its users.
Additional permissions should be obtained from the applicable author or publisher of the image.
Full text @ Elife