
Image
|
Figure Caption
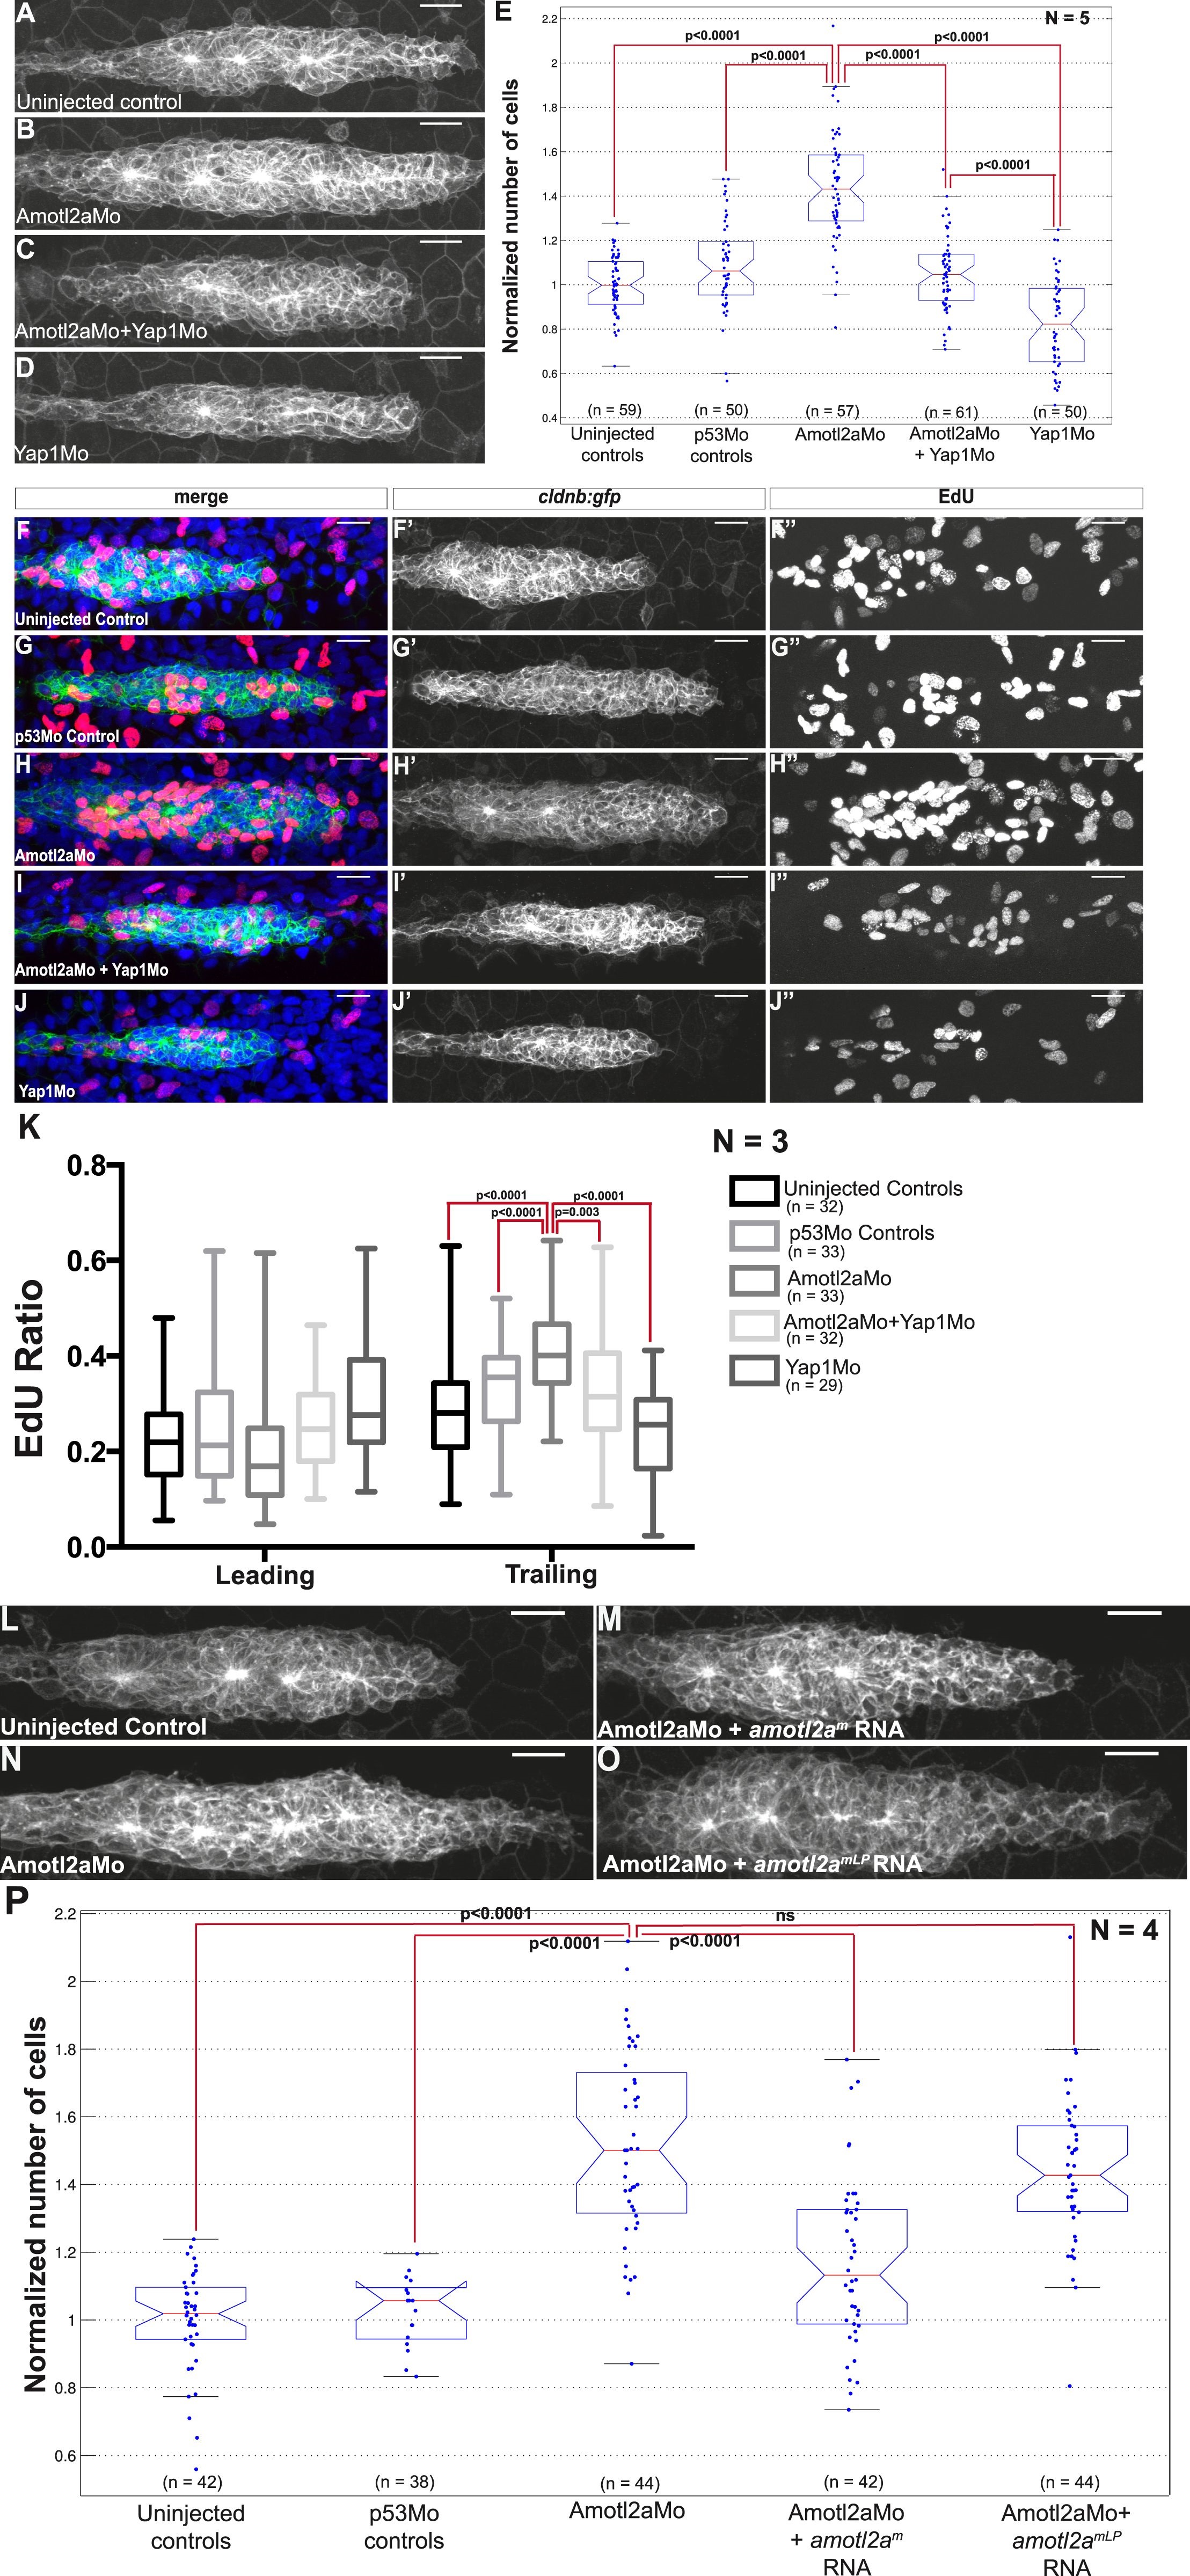
Fig. 6 Loss of Yap1 suppresses the increased cell proliferation in amotl2a morphant.
(A–D, L–O) MIP of Z-stacks of pLLP in cldnb:gfp embryos injected as indicated. (E, P) Corresponding boxplots comparing pLLP cell counts. (F–J′′) MIP of Z-stacks of pLLP in cldnb:gfp embryos stained with EdU and DAPI showing the EdU (right panels), cell membranes (middle panels), and merged channels (left panels). (K) Corresponding boxplot showing the EdU index in the leading and trailing regions of the pLLP in the indicated experimental conditions (Figure 6—source data 1–3; Figure 6—figure supplement 1, Figure 6—source data 4).
Figure Data
Acknowledgments
This image is the copyrighted work of the attributed author or publisher, and
ZFIN has permission only to display this image to its users.
Additional permissions should be obtained from the applicable author or publisher of the image.
Full text @ Elife