
Fig. S3
- ID
- ZDB-IMAGE-151113-8
- Publication
- Xu et al., 2015 - Temporal-Spatial Resolution Fate Mapping Reveals Distinct Origins for Embryonic and Adult Microglia in Zebrafish
- All Figures
- Figures for Xu et al., 2015
|
Fig. S3
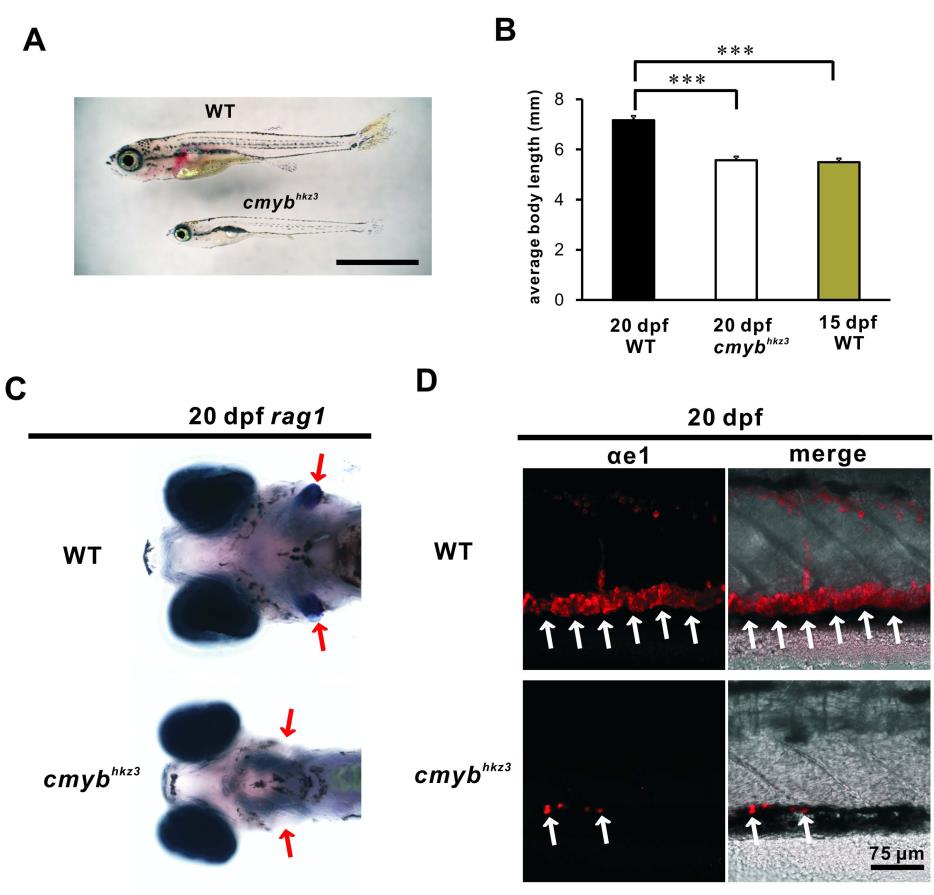
The cmybhkz3 Mutants Exhibit a Developmental Delay and Lack T Lymphocytes and Erythrocytes.
(A) Imaging of 20 dpf WT and cmybhkz3 mutant. The upper larva is the WT and the lower larva is the cmybhkz3 mutant. The scale bar represents 2 mm.
(B) Quantification of total body length of 20 dpf WT (n=11), cmybhkz3 mutant (n=10) and 15 dpf WT larvae (n=11). Error bars represent mean SEM. ***, P<0.001.
(C) T cell marker rag1 is greatly reduced in 20 dpf cmybhkz3 mutants (lower panel) comparing with WT (upper panel). Red arrows indicate the position of thymus.
(D) Only trace amount of erythrocyte marker hemoglobin αe1 is detected in the cmybhkz3 mutant (lower panel) comparing with WT (upper panel) at 20 dpf. White arrows indicate erythrocytes in the tail region.
Reprinted from Developmental Cell, 34, Xu, J., Zhu, L., He, S., Wu, Y., Jin, W., Yu, T., Qu, J.Y., Wen, Z., Temporal-Spatial Resolution Fate Mapping Reveals Distinct Origins for Embryonic and Adult Microglia in Zebrafish, 632-641, Copyright (2015) with permission from Elsevier. Full text @ Dev. Cell