
Image
|
Figure Caption
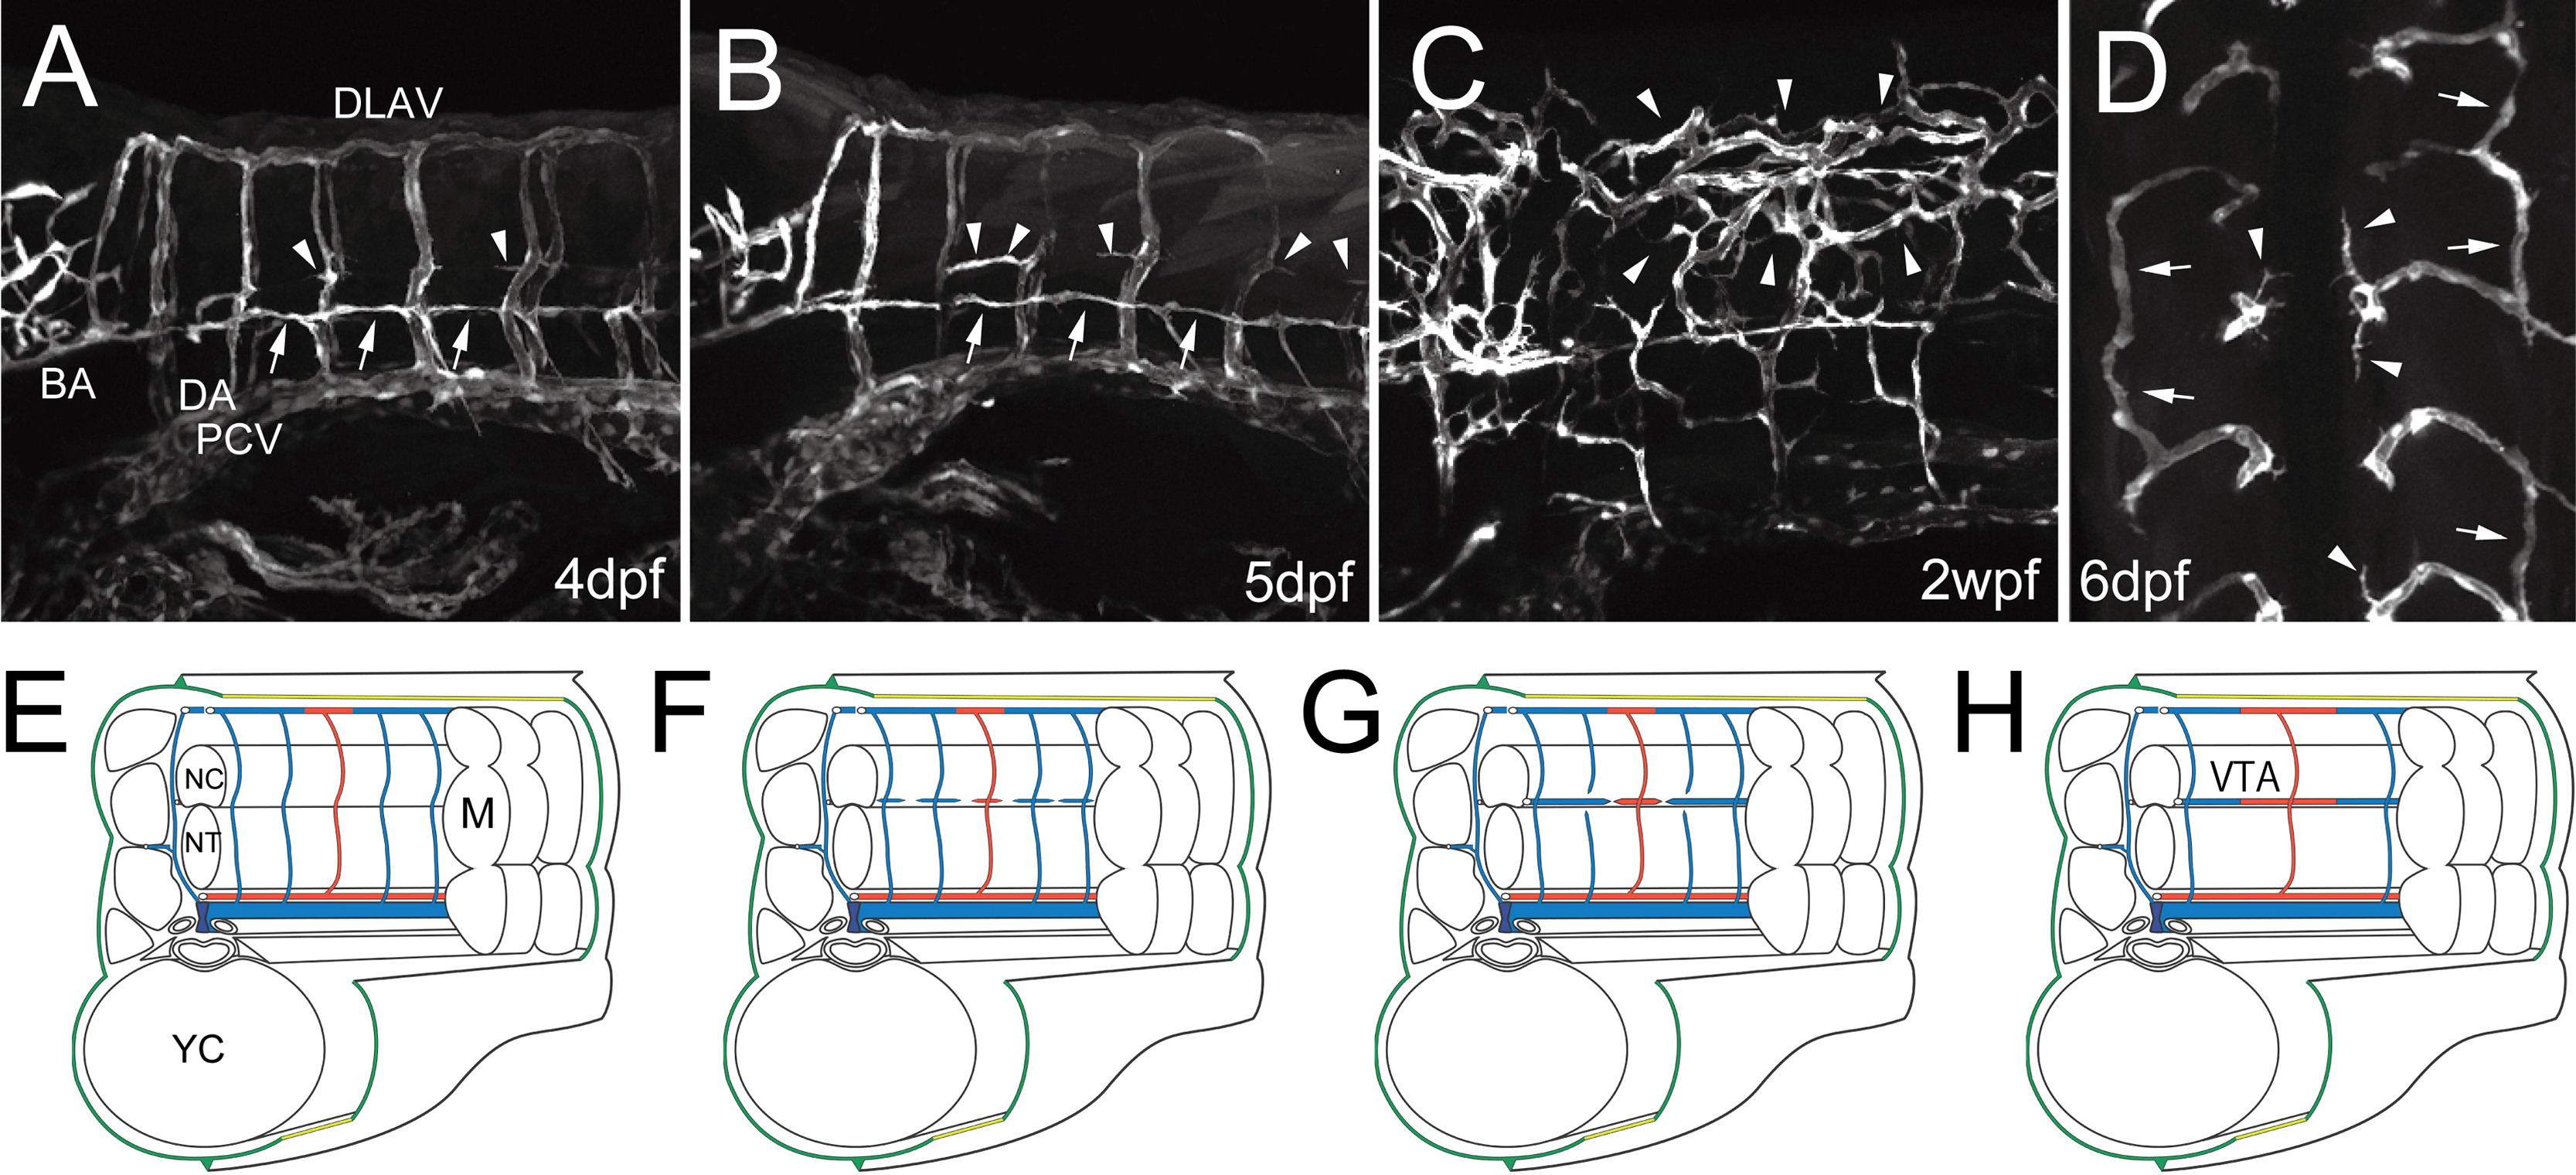
Fig. 5
Formation of VTAs. Multi-photon microscopic image of Tg(flk1:EGFP)k7 embryos at 4 (A); 5 (B); and 6 dpf (D), and 2 wpf (C). Lateral (A–C) and dorsal (D) views. (E–H) Schematic diagrams of stepwise VTA formation. SeA and SeV indicate by red- and blue-colored lines respectively. Arrowheads indicate the parachordal vessels. Arrows indicate VTAs. NC: notochord. NT: neural tube. M: myotome. YC: yolk sac.
Acknowledgments
This image is the copyrighted work of the attributed author or publisher, and
ZFIN has permission only to display this image to its users.
Additional permissions should be obtained from the applicable author or publisher of the image.
Reprinted from Developmental Biology, 406(1), Kimura, E., Isogai, S., Hitomi, J., Integration of vascular Systems between the brain and spinal cord in zebrafish, 40-51, Copyright (2015) with permission from Elsevier. Full text @ Dev. Biol.