
|
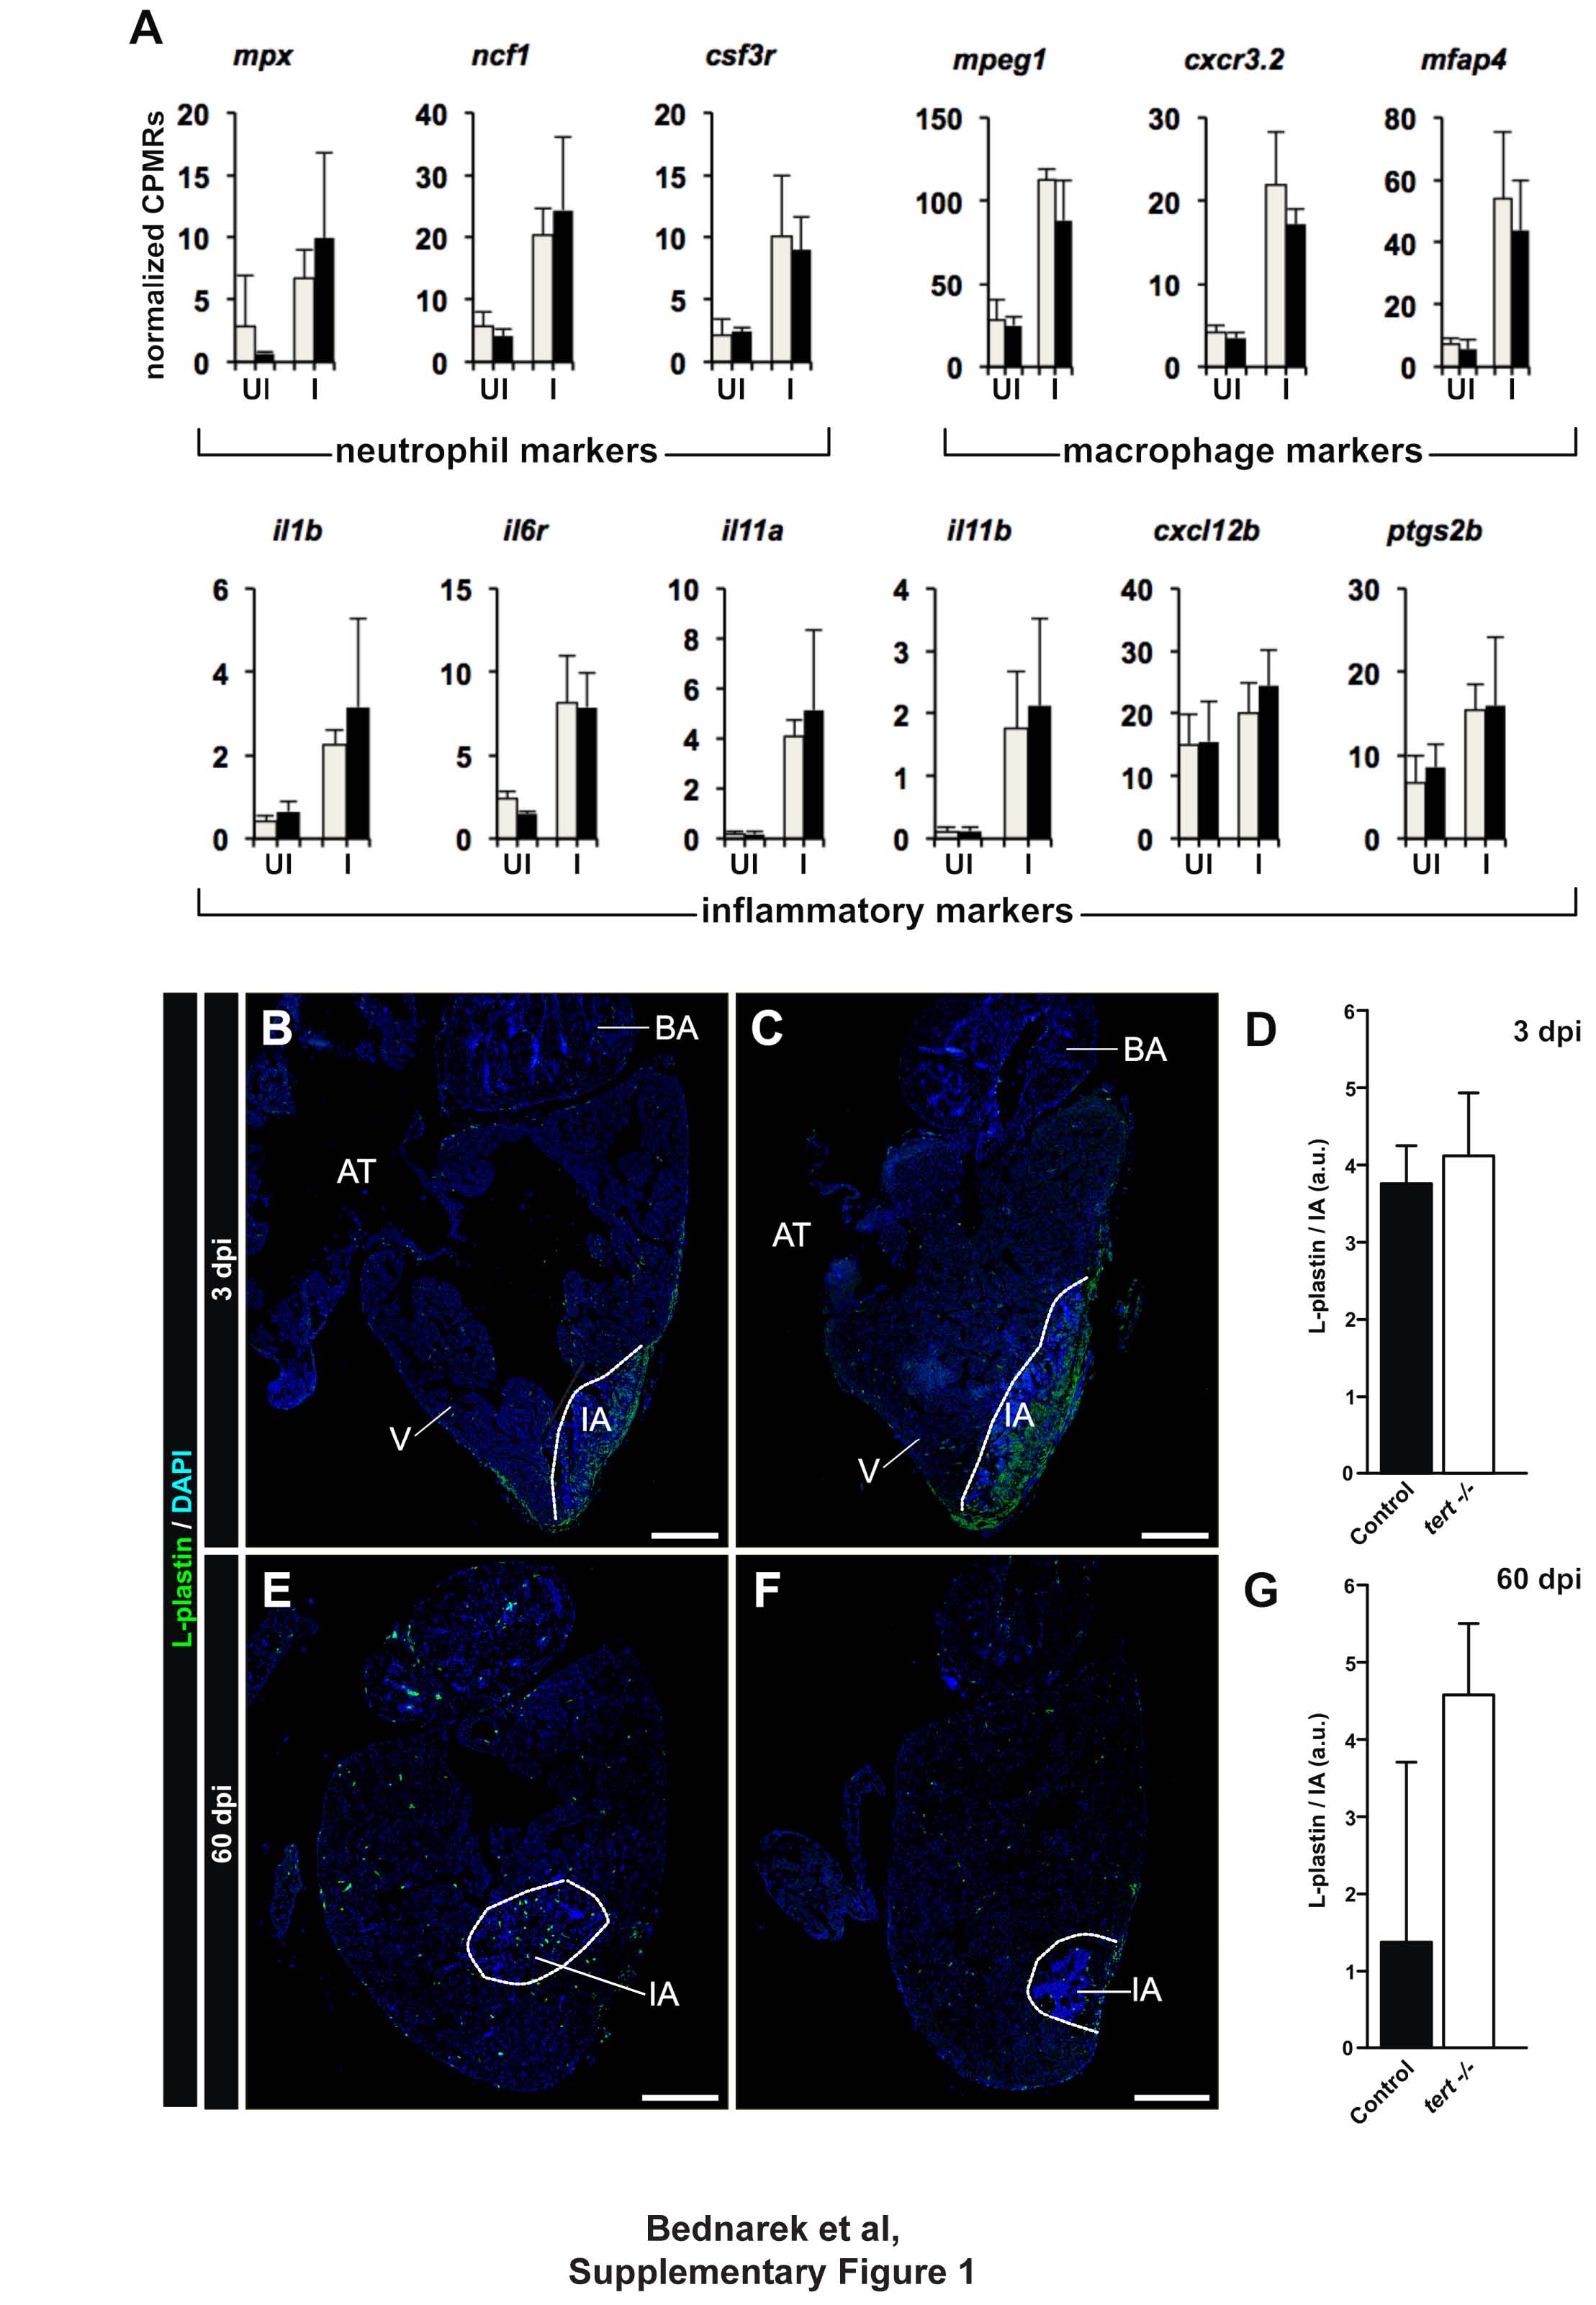
Fig. S1
Inflammatory response in cryoinjured tert-/- zebrafish hearts.
(A) RNA expression of neutrophil, macrophage and inflammatory marker genes in wildtype (WT, grey bars) and tert-/- zebrafish hearts (black bars), uninjured or 3 days postinjury (dpi). Injury led to an increase in the expression of the markers analyzed both in WT and tert-/- hearts. Differences between WT and tert-/- zebrafish hearts are non-significant in all cases (B-H adjusted p-value). Data are means ± SEM of values obtained from an RNA-seq experiment of 4 biological replicates, each replicate consisting of 3 pooled hearts. CPM, counts per million; dpi, days postinjury; I, injured; UI, uninjured.
(B-G) Immunofluorescence of L-plastin (green) on WT (B,E) and tert-/- (C,F) heart sections and the quantification of L-plastin positive cells at 3 (B-D) and 60 dpi (E-G). DAPI was used to counterstain nuclei (blue). Graphs show means ± SEM L-plastin signal in the injured area (IA) and within 50 µm of the border zone on sections from 3 hearts per condition. The IA is outlined by a dotted line. AT, atrium; a.u. arbitrary units; BA, bulbus arteriosus; dpi, days postinjury; IA, injured area; V, ventricle. Bars, 200 µm.
Related to Figure 2.