
Image
|
Figure Caption
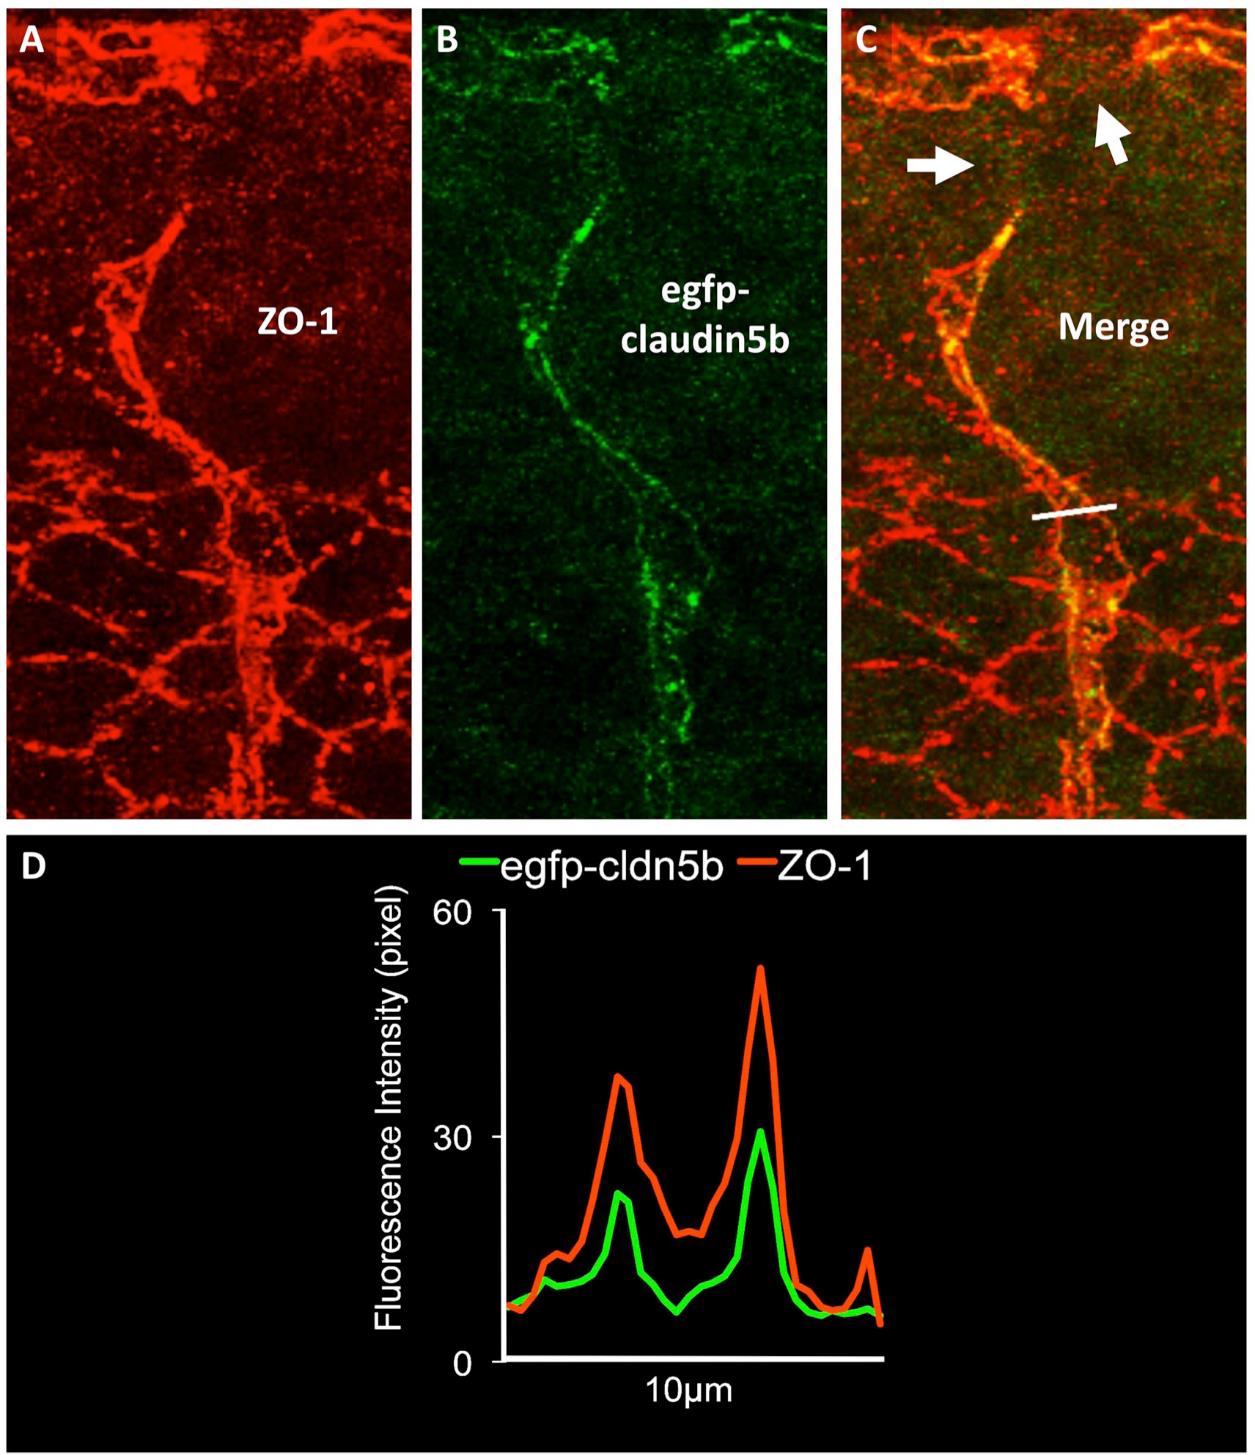
Fig. S4 (A-C) Confocal micrograph of whole mount immunohistochemistry of a dorsal trunk ISV/DLAV segment in a 48 hpf Tg(fli1a:egfp-claudin5b)y287 transgenic animal probed with anti-ZO-1 (panels A,C) and anti-EGFP (panels B,C) antibodies. The white line in panel C shows the trace used to measure red (ZO-1) and green (egfp-claudin5b) fluorescence intensity in panel D. (D) Fluorescent pixel intensity of egfp-claudin5b (green) and ZO-1 (red) along the line shown in panel C. Scale bar = 10 µm.
Acknowledgments
This image is the copyrighted work of the attributed author or publisher, and
ZFIN has permission only to display this image to its users.
Additional permissions should be obtained from the applicable author or publisher of the image.
Full text @ Development