
|
Fig. 5
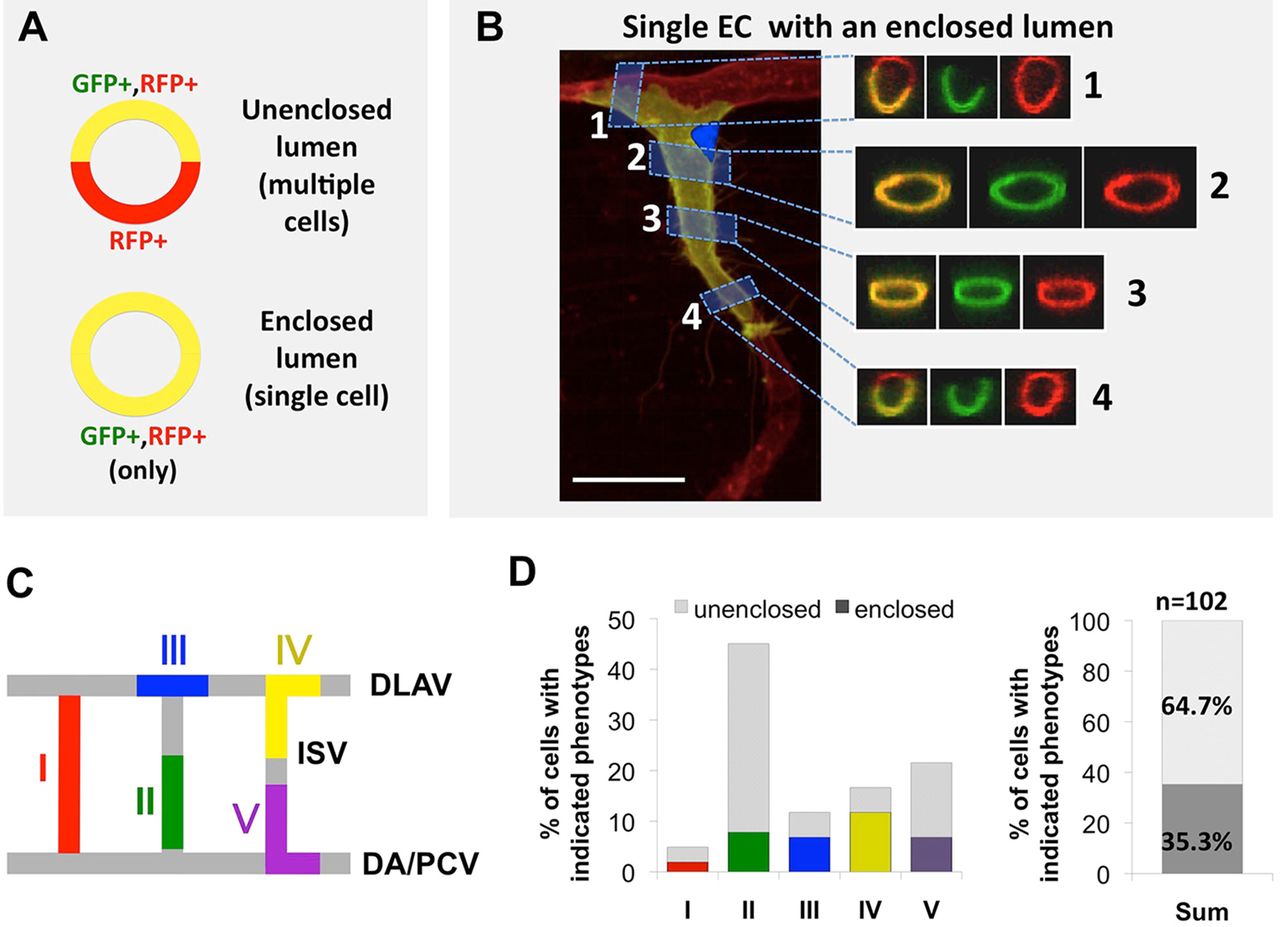
Endothelial lumen heterogeneity revealed by single-cell 3D reconstruction. (A) Schematics showing potential configurations of verified single Tol2(fli1a:H2B-TagBFP-p2A-egfp-F) transgene-expressing ECs adjoining lumenal spaces, in cross-sections of vessels containing these cells from transgene-injected Tg(kdrl:mRFP-F)y286 embryos. Unenclosed lumen: if multiple cells enclose a lumen segment (top), both GFP/RFP double-positive (expressing the injected transgene) and RFP single-positive (not expressing the injected transgene) sectors of the vessel will be detected (see B, 1 and 4). Enclosed lumen: if only a single cell encloses a lumen segment (bottom), the vessel wall will be entirely GFP/RFP double positive (expressing the injected transgene; see B, 2 and 3). (B) Confocal images of a verified single Tol2(fli1a:H2B-TagBFP-p2A-egfp-F) transgene-expressing EC (yellow) in the dorsal part of a Tg(kdrl:mRFP-F)y286 vessel (red). The left panel shows a lateral view reconstruction of the entire cell, with the single nucleus visible by blue fluorescence. To the right are red/green merge (left), green and red fluorescence images of four image slices. Slices 1 and 4 show lumens bounded by both the injected transgenic EC and other EC(s). Slices 2 and 3 show lumens bounded by only the single injected transgene-positive EC. (C) Morphological classification of ECs contributing to the ISV/DLAV (see Fig. 3 for details). (D) Quantification of the proportion of ECs with unenclosed (gray) or enclosed (colored) lumen found in each of the five morphological classes and in total combined trunk ECs. Scale bar: 20µm.