
|
Fig. 4
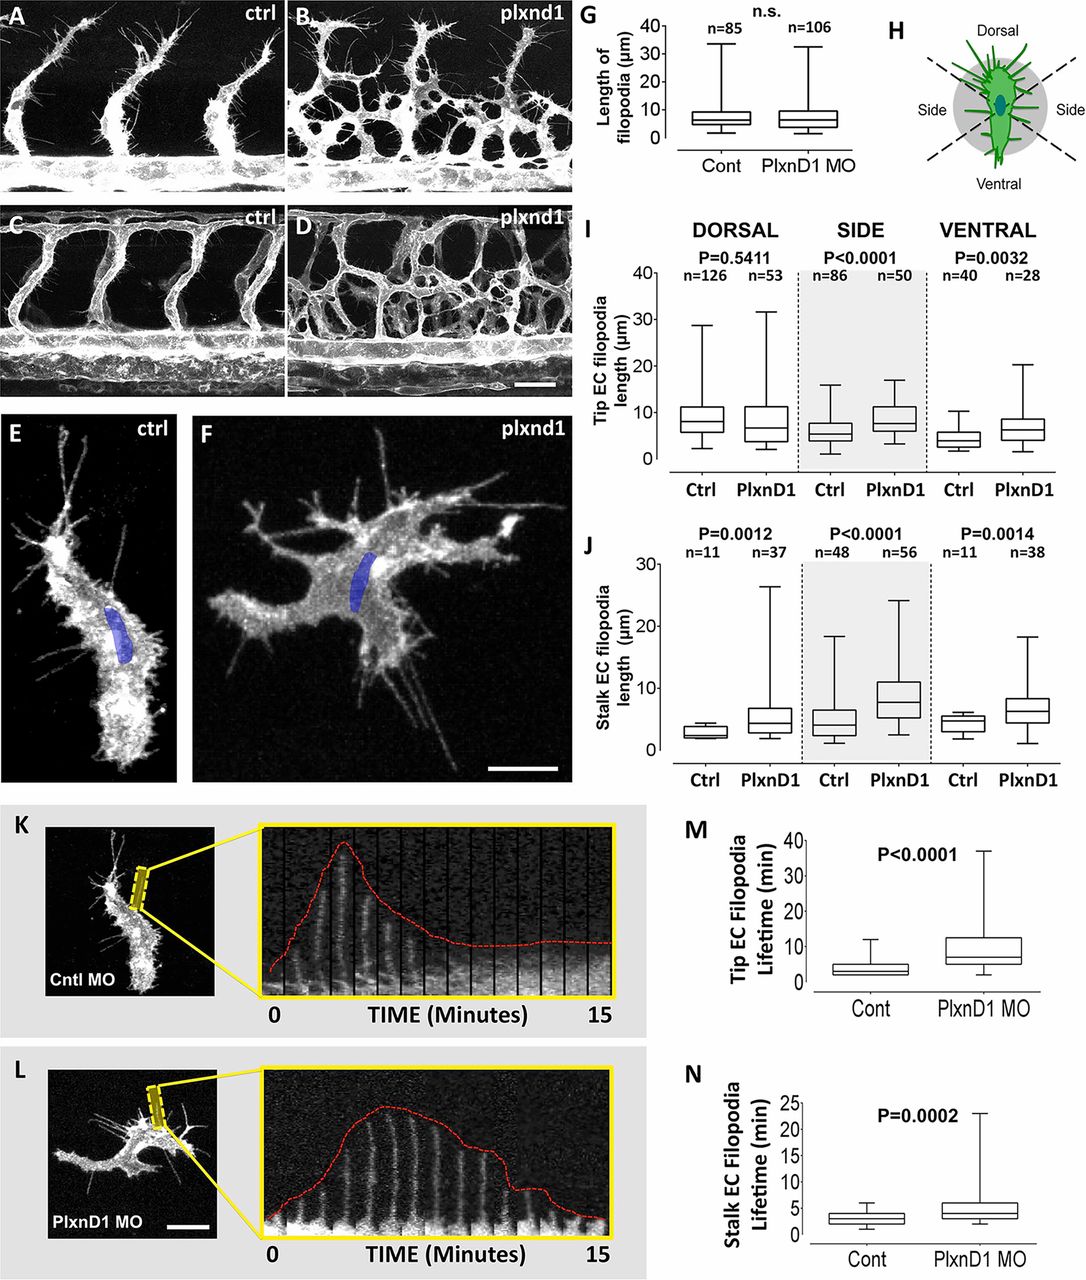
Measuring endothelial protrusiveness, polarity and dynamics using single-EC imaging in vivo. The spatial distribution of filopodia in individual ECs is polarized during normal ISV network patterning. (A-D) Confocal images of mid-trunk vessels in 30 (A,B) or 42 (C,D) hpf in Tg(fli1a:egfp)y1 control (A,C) or plxnd1 (B,D) morpholino-injected embryos, showing disorganization of the ISV network in Plxnd1-deficient animals. (E,F) Higher magnification confocal micrographs of verified single Tol2(fli1a:H2B-TagBFP-p2A-egfp-F) transgene-expressing ECs in the trunks of <30hpf Tg(kdrl:mRFP-F)y286 control (E) or plxnd1 (F) morpholino-injected embryos. GFP-F fluorescence is in gray, H2B-TagBFP-positive nuclei are in blue. (G) Quantification of the average total length of EC protrusions in ECs from control or plxnd1 morpholino-injected embryos. (H) Diagram showing the quadrants used for assessing the directionality of endothelial protrusions – dorsal, ventral and side. (I,J) Quantification of the average total length of protrusions from (I) endothelial tip cells (cells at the leading front) and (J) endothelial stalk cells (cells not at the leading front) in control or plxnd1 morpholino-injected embryos grouped by whether they protrude dorsally, to the side or ventrally. The data in G, I and J are collected from six independent experiments. (K,L) Representative confocal kymographs of endothelial protrusions on verified single Tol2(fli1a:H2B-TagBFP-p2A-egfp-F) transgene-expressing ECs in the trunks of <30hpf Tg(kdrl:mRFP-F)y286 control (K) or plxnd1 (L) morpholino-injected embryos. GFP-F fluorescence is in gray, H2B-TagBFP-positive nuclei are in blue. (M,N) Quantification of the average lifetime of protrusions emerging from (M) six endothelial tip cells (cells at the leading front) and (N) six endothelial stalk cells (cells not at the leading front) in control or plxnd1 morpholino-injected embryos. The data in M and N were collected from four independent experiments. Box-and-whisker plots (G,I,J,M,N) represent interquartile range (spanning from first to third quartile with median segment inside) in the box, minimum and maximum values (whiskers) at both ends. P-values were derived by unpaired two-tailed Student′s t-test. n.s., not significant. All images are lateral views with rostral to the left. Scale bars: 25µm in A-D; 10µm in E,F,K,L.