
|
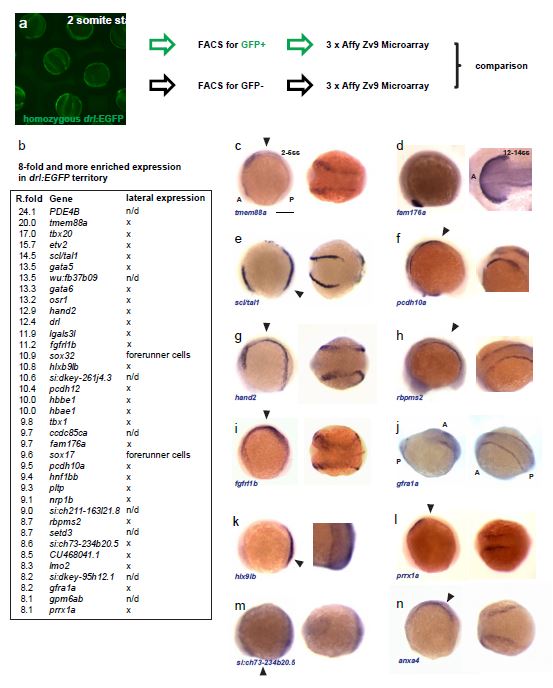
Fig. S3 The transcriptome of the drl-positive lateral mesoderm at the beginning of segmentation. (a), schematic of the performed Affymetrix Zv9 microarray experiment; 2 somite stage drl:EGFP homozygous embryos were collected, dissociated, their EGFP-positive and –negative cell populations separated by FACS, the isolated RNA from both populations was subjected to microarray analysis, and the resulting gene expression lists from both populations compared. This resulted in a list of genes that are preferentially expressed in the drl-positive lateral territory. (b), excerpt of the enriched gene list (8-fold or higher), including expression analysis by RNA ISH. (c-n), validation of lateral expression by mRNA ISH for selected candidates from the microarray analysis; for each gene, a lateral view (left, anterior (A) to the left, posterior (P) to the right) and detail view (right, point of view shown by arrow head in lateral view) is shown for 2-5 ss embryos if not depicted otherwise; scale bar = 100 µm.