
|
Fig. 1
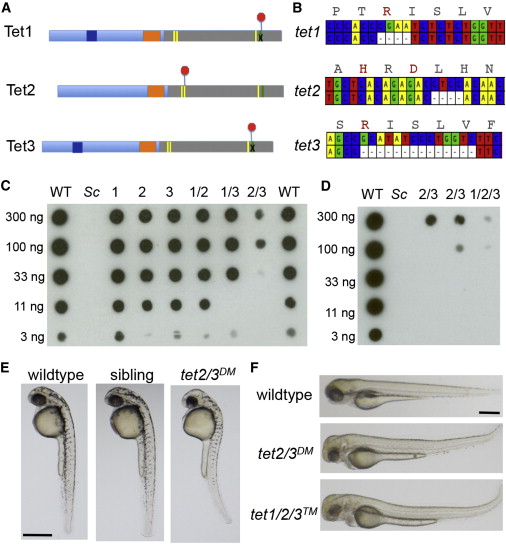
Mutation of Zebrafish tet1, tet2, and tet3
(A) Schematic illustrating early termination caused by TALEN mutations in zebrafish tet1, tet2, and tet3. Red octagons indicate the position of early termination signals. Yellow bars indicate conserved iron binding residues, and the green bar indicates the arginine required for 2-oxoglutarate binding.
(B) Schematic depicting deleted bases in zebrafish tet1, tet2 and tet3. Corresponding amino acid sequences for the wild-type allele are included, with residues required for cofactor binding or catalysis indicated in red.
(C) Dot blot for 5hmC on genomic DNA isolated from larvae at 5 dpf. Numbers indicate the mutated tet gene(s) in each sample. Sc indicates DNA isolated from Saccharomyces cerevisiae. Horizontal rows depict 3-fold serial dilutions of DNA.
(D) Dot blot for 5hmC on genomic DNA isolated from larvae at 5 dpf including DNA isolated from tet1/2/3TM larvae.
(E) Lateral views of a representative wild-type larva, a tet2/3DM larva and a sibling larva derived from a tet2mk17/mk17, tet3mk18/+ intercross at 36 hpf.
(F) Lateral views of a representative wild-type larva, a tet2/3DM larva and tet1/2/3TM larva at 3 dpf.
All scale bars indicate 500 µM. See also Figure S1.