
|
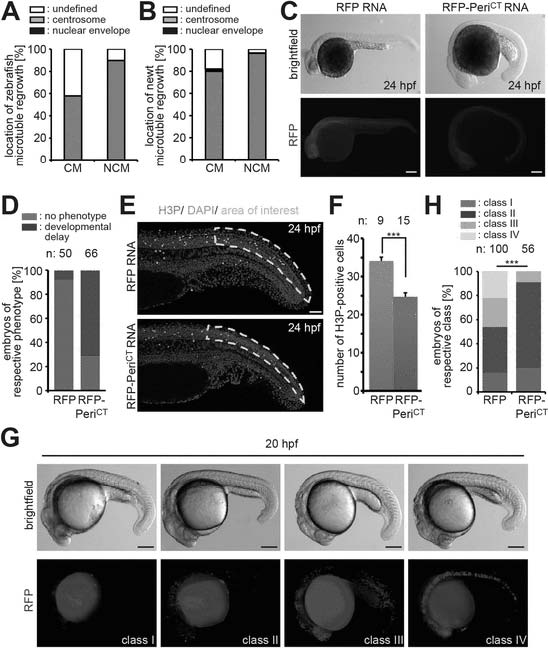
Fig. 4, S1
(A) Frequency of MTOC localization in adult zebrafish cardiomyocytes (CM) and non-myocytes (NCM) after nocodazole wash out. Cardiomyocytes from 12 hearts were pooled and 50 CMs and 50 NCMs were analyzed. (B) Frequency of MTOC localization in adult newt CM and NCM after microtubule depolymerization with ice. Cardiomyocytes from 10 hearts were pooled and > 50 CMs and > 50 NCMs were analyzed. (C) Expression of dominant negative Pericentrin (RFP-PeriCT) via RNA injection caused developmental delay in zebrafish embryos at 24 hr post fertilization (hpf) compared to RFP RNA-injected control embryos. (D) Percentage of embryos showing a normal or developmental delayed phenotype in each group. (E) Representative images of RFP and RFP-PeriCT RNA-injected zebrafish embryos stained for mitotic cells (H3P). (F) Quantification of H3P events in the area of interest as defined in (E). (G) Representative images of clone classes in RFP DNA-injected embryos at 20 hpf. (H) Percentages of embryos in different classes in RFP or RFP-PeriCT DNA-injected embryos. Data are mean ± SEM; n = total number of embryos analyzed. ***: p < 0.001. Scale bars: yellow/black: 250 µm; white: 50 µm.