
|
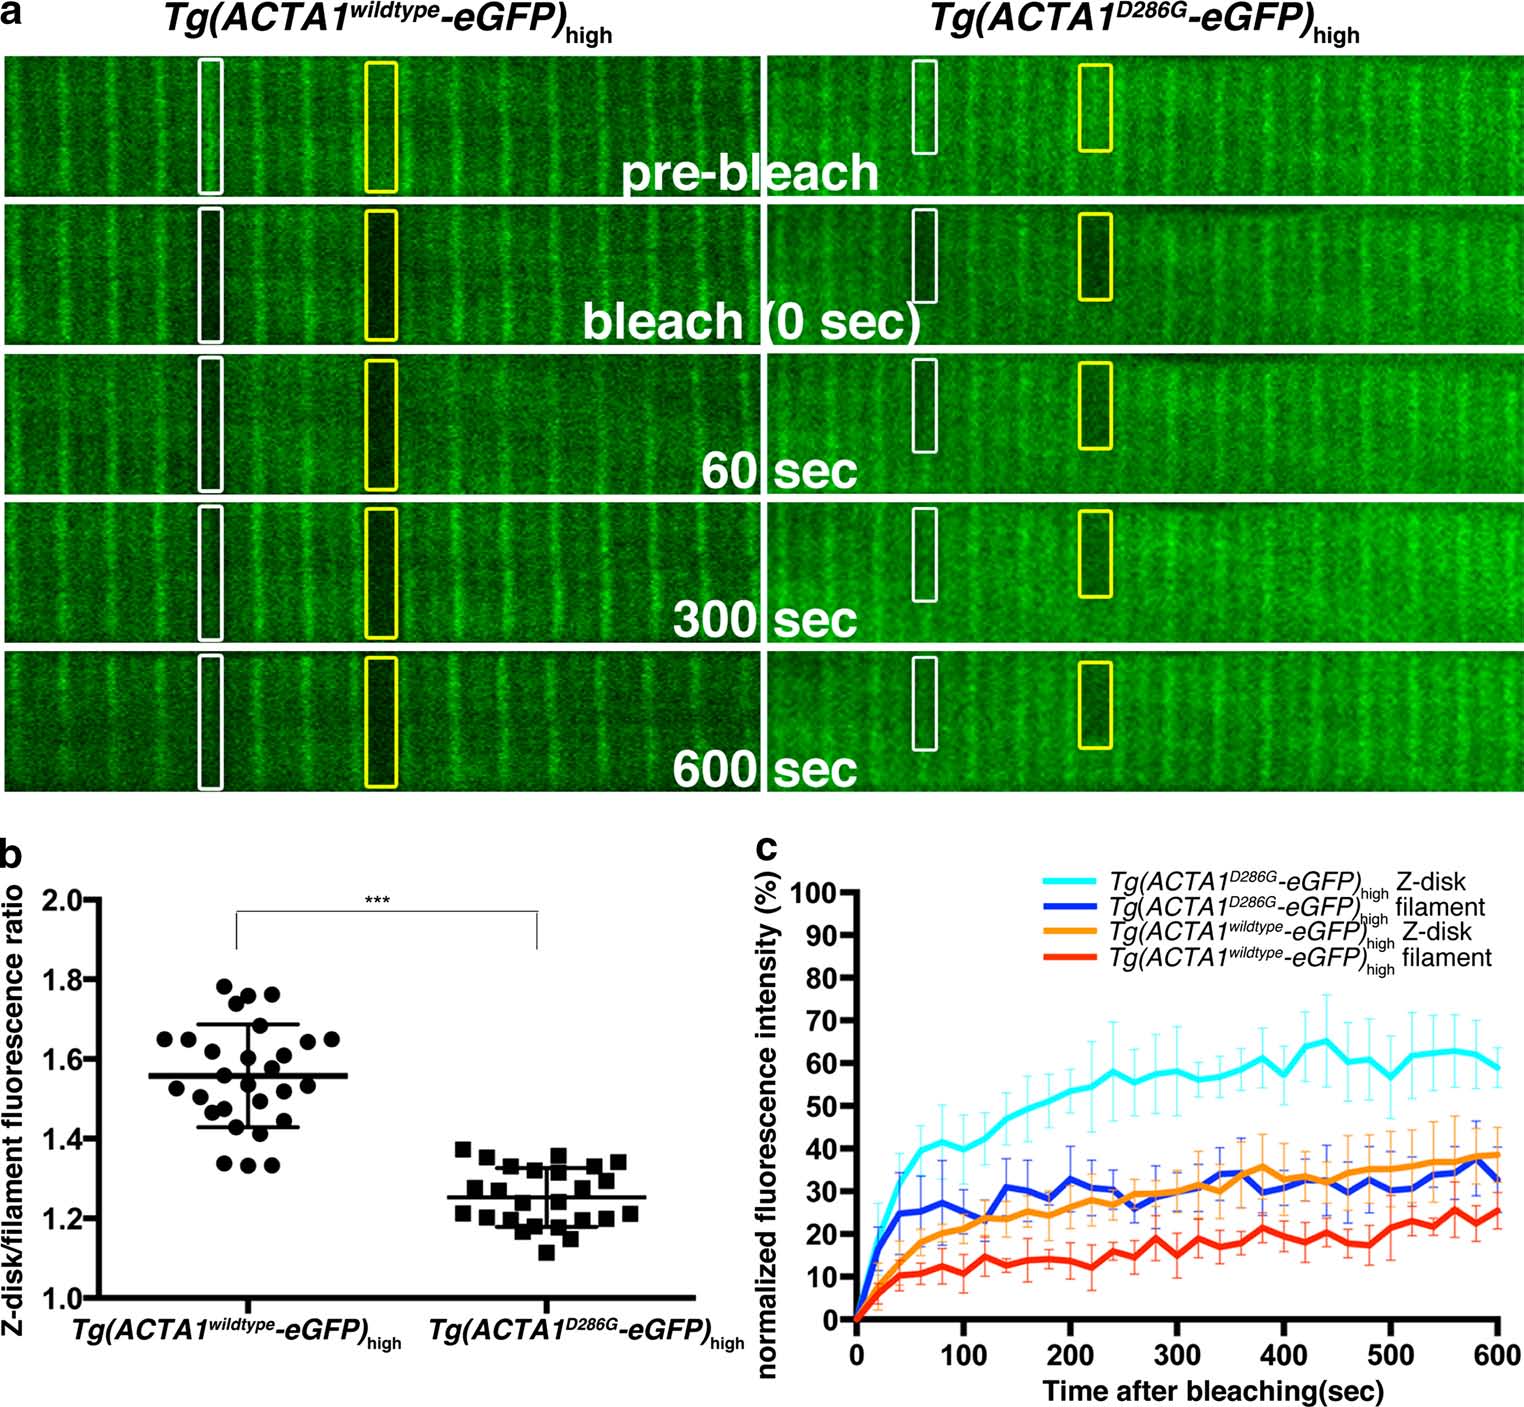
Fig. 13
Fluorescence recovery after photobleaching (FRAP) analyses of ACTA1 and ACTA1D286G. a Confocal images of ACTA1-eGFP localization at the Z-disk (white boxes) and along the thin filament (yellow boxes) in single muscle fibers of Tg(ACTA1 D286G-eGFP)high and Tg(ACTA1 wildtype -eGFP) high embryos at 2 dpf. Image sequence shows ACTA1-eGFP prior to photobleaching (pre-bleach), at the time of photobleaching (bleach, 0 s), and 60, 300 and 600 s following photobleaching. Prior to photobleaching eGFP in Tg(ACTA1 wildtype-eGFP) high muscle is primarily localized to the Z-disk (white boxes), whereas in Tg(ACTA1 D286G-eGFP) high fibers, eGFP expression is more diffuse throughout the filament (yellow boxes). b Quantification of the fluorescence intensity at the Z-disk compared to the filament in Tg(ACTA1 D286G -eGFP) high and Tg(ACTA1 wildtype -eGFP) high muscle fibers. Error bars represent SD for 12 animals (quantifying 2 fibers per animal), ***p < 0.001. c Recovery profiles for ACTA1-eGFP and ACTA1D286G-eGFP at the Z-disk and filament. Error bars represent SD for 8–10 animals (quantifying 2 fibers per animal)