
|
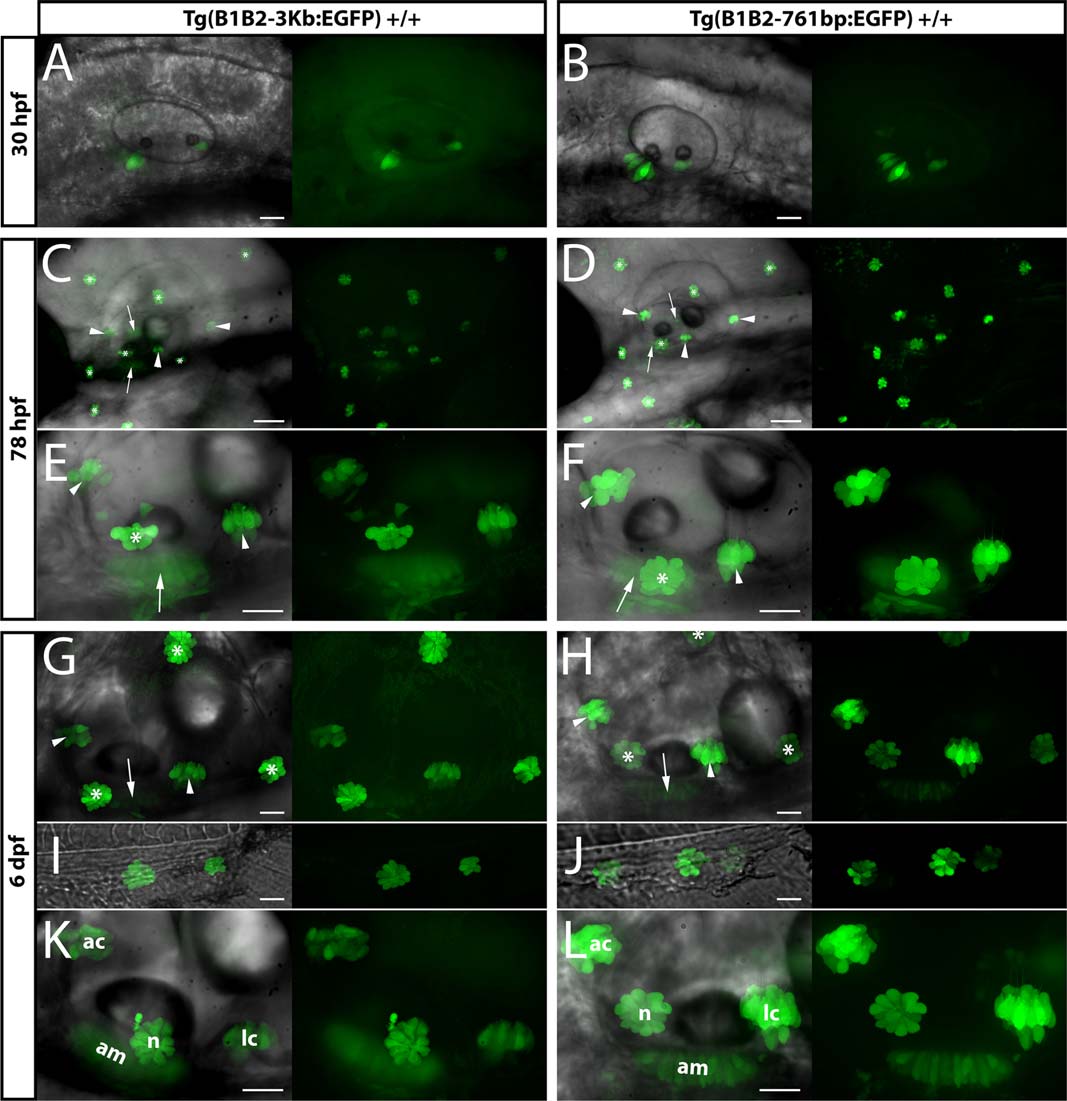
Fig. 3
Expression of EGFP in fish transgenic for B1B2-3Kb and B1B2-761bp DNA fragments. Lateral views of homozygous transgenic zebrafish embryos. Panels A,C,E,G,I,K: line Tg(B1B2-3Kb:EGFP); panels B,D,F,H,J,L: line Tg(B1B2-761bp:EGFP). Each transgenic line was derived from one founder F0 fish: founder #3B for the 3KB DNA fragment (out of 3 F0 founders) and founder #2A for the 761 bp DNA fragment (out of 2 F0 founders). Live embryos were anesthetized with tricaine and mounted in agarose before imaging on a Leica spinning disk microscope. All images are z-axis projections. Embryonic stages imaged were: 30 hpf (A,B), 78 hpf (C–F), 6 dpf (G–L). Each panel comprises the superimposition of bright field with fluorescence image (left part) and the fluorescence image (right part) of the exact same area of the embryo. Panels C–H: arrow = anterior or posterior maculae; arrowhead = anterior, lateral or posterior cristae; * = neuromast. Panels K and L: am = anterior maculae; ac = anterior cristae; lc = lateral cristae; n = neuromast. Scale bar: 20 µm in all panels except for panels C and D (50 µm). C and E as well as D and F represent the same area acquired at a different magnification (20X objective for C and D, 63X objective for E and F).