
|
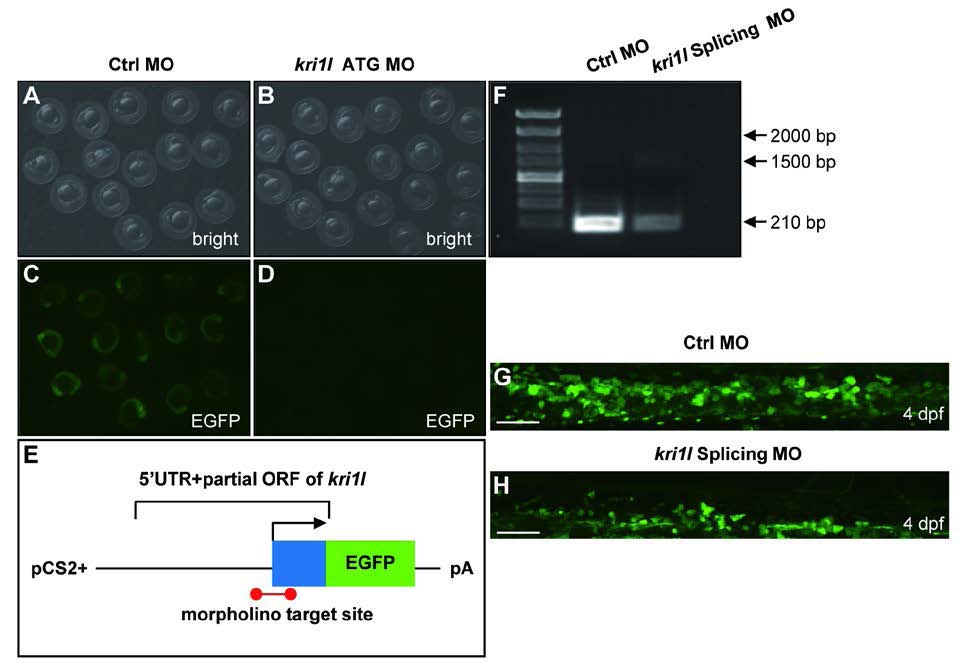
Fig. S7 Validation of kri1l MO efficiency. (A-D) Bright field and fluorescent images of zebrafish embryos at 20 hpf after injection of kri1l (1-60)-GFP reporter mRNA and control MO or kri1l MO respectively at 1-cell stage. (E) Schematic presentation of the kri1l (1-60)-GFP reporter plasmid used to test the knockdown efficiency of MO. The 5′UTR and partial open reading frame (ORF) of kri1l gene depicted as the blue box was fused to the ATG-deleted open reading frame of EGFP shown as the green box in the pCS2+ plasmid. The red colored bar denotes the targeted site recognized by MO. (F) The efficiency assessment of kri1l splicing MO knockdown. PCR products for normal splicing fragment is 210 bp, the predicted abnormal splicing is around 1600 bp. Injection of kri1l splicing MO significantly decreases the level of normal kri1l mRNA. (G-H) Representative confocal images of EGFP+ cells in control morphants and morphants in the Tg(cmyb: egfp) background. Scale bars: 50 µm. The number of EGFP+ cells is decreased in kri1l morphants at 2 dpf (p=0.0001). Error bars represent standard error of the mean (SEM). **, P≤0.01; ***, P≤0.001 (Student t test).