
Image
|
Figure Caption
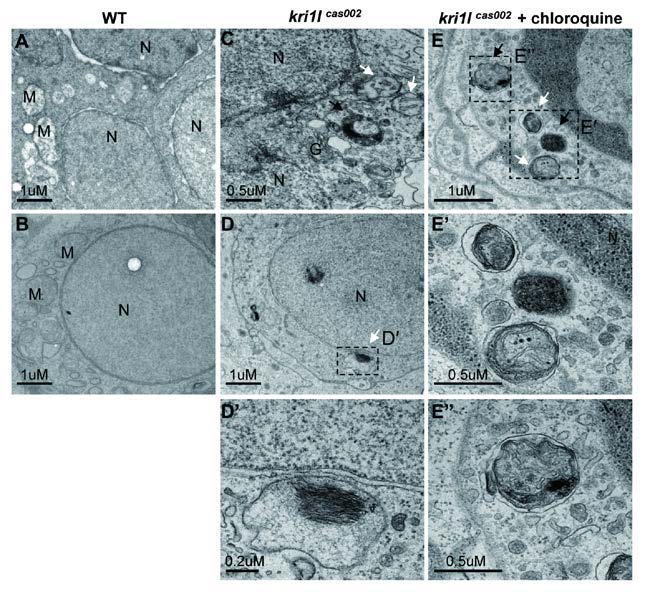
Fig. S17 The cells in kri1lcas002 mutants contain autophagosome- and autolysome-like structures. Electron micrographs of 3 dpf embryos of WT (A-B), mutants (C-D) and mutants with chloroquine treated (E). White arrows indicate double-membrane autophagosomes, black arrows indicate autolysosomes. N = nucleus. M= Mitochondria. G= Golgi. Scale bars of A, B, D, and E: 1 µm. Scale bars of C, E′ and E′′: 0.5 µm. Scale bars of D′: 0.2 µm.
Figure Data
Acknowledgments
This image is the copyrighted work of the attributed author or publisher, and
ZFIN has permission only to display this image to its users.
Additional permissions should be obtained from the applicable author or publisher of the image.
Full text @ Cell Res.