
|
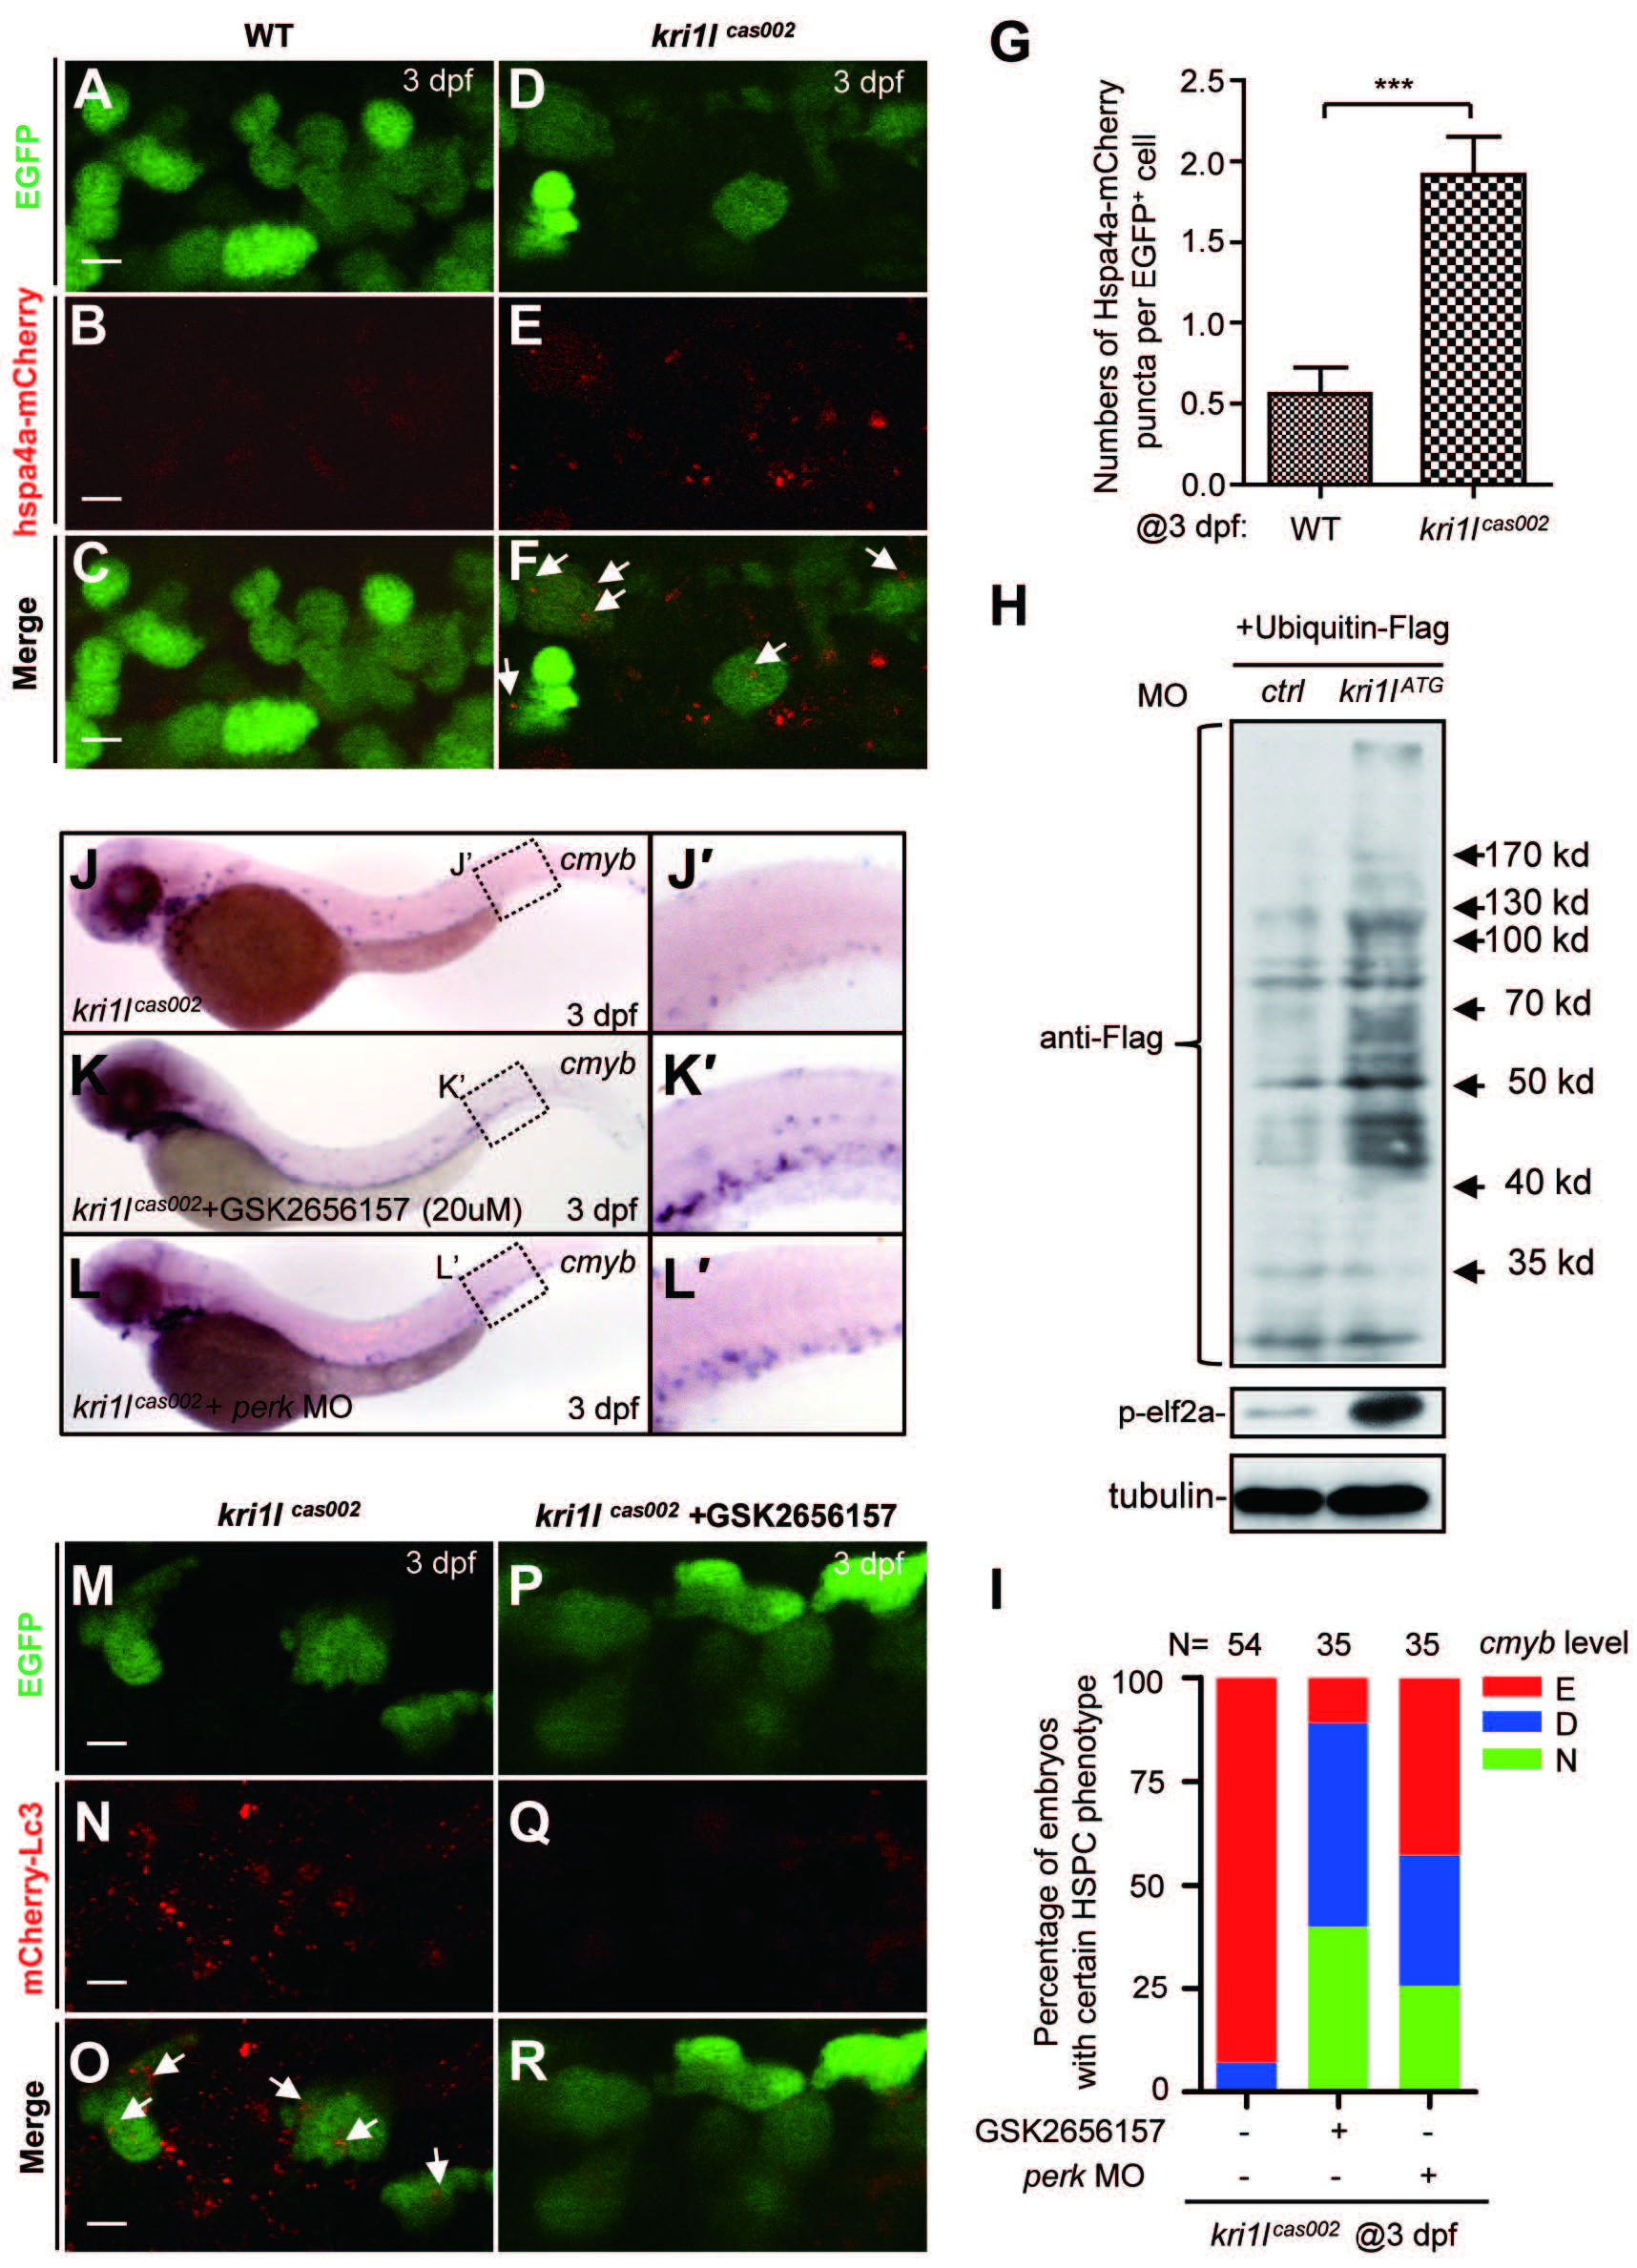
Fig. 6
Accumulation of unfolded proteins and PERK activation leads to excessive autophagy and hematopoiesis failure. (A-G) Representative confocal images (A-F) and Quantitation (G) of Hspa4a-mCherry puncta (aggregation of misfolded protein) in HSPCs of live zebrafish embryos. Wild-type siblings or kri1lcas002 mutant embryos in the Tg (cmyb:egfp) transgenic background were injected with hspa4a-mcherry mRNA at one-cell stage and imaged at 3 dpf. The numbers of misfolded protein puncta are increased in kri1lcas002 embryos compared to that in wild-type siblings, P = 0.0002. Hspa4a-mCherry puncta were counted in over 30 EGFP+ cells (in the Tg (cmyb: egfp) background) per embryo, total 10-12 embryos. Error bars represent SEM. **P ≥ 0.01; ***P ≤ 0.001 (Student′s t-test). Scale bars, 5 µm. (H) Representative immunoblotting analysis of the level of protein ubiquitination and phospho-eif2a in whole embryo lysates of WT and kri1lcas002 embryos at 3 dpf injected with Flag-tagged ubiquitin plasmid at one-cell stage. Tubulin serves as the loading control. (I) Treatment with PERK inhibitor GSK2656157 or injection of perk MO rescues cmyb expression in HSPCs. Kri1lcas002 mutant embryos were treated with GSK2656157 (20 µM) from 36 hpf to 72 hpf, or injected with perk MO at one-cell stage. After WISH and imaging, all embryos were genotyped. 14 out of 35 mutant embryos treated with GSK2656157 are fully rescued, while 17 out of 35 mutant embryos are rescued partially. 9 out of 35 mutant embryos injected with perk MO are fully rescued, while 11 out of 35 mutant embryos are rescued partially. (J-L) Proportion of kri1lcas002 mutant embryos with classified hematopoiesis phenotype with or without GSK2656157 treatment, or with microinjection of perk MO. (M-R) GSK2656157 inhibits excessive autophagy in kri1lcas002 HSPCs. Representative confocal images of mCherry-Lc3 puncta (autophagosomes) in kri1lcas002 mutant embryos in Tg (cmyb:egfp) transgenic background are shown. Scale bars, 5 µm.