
|
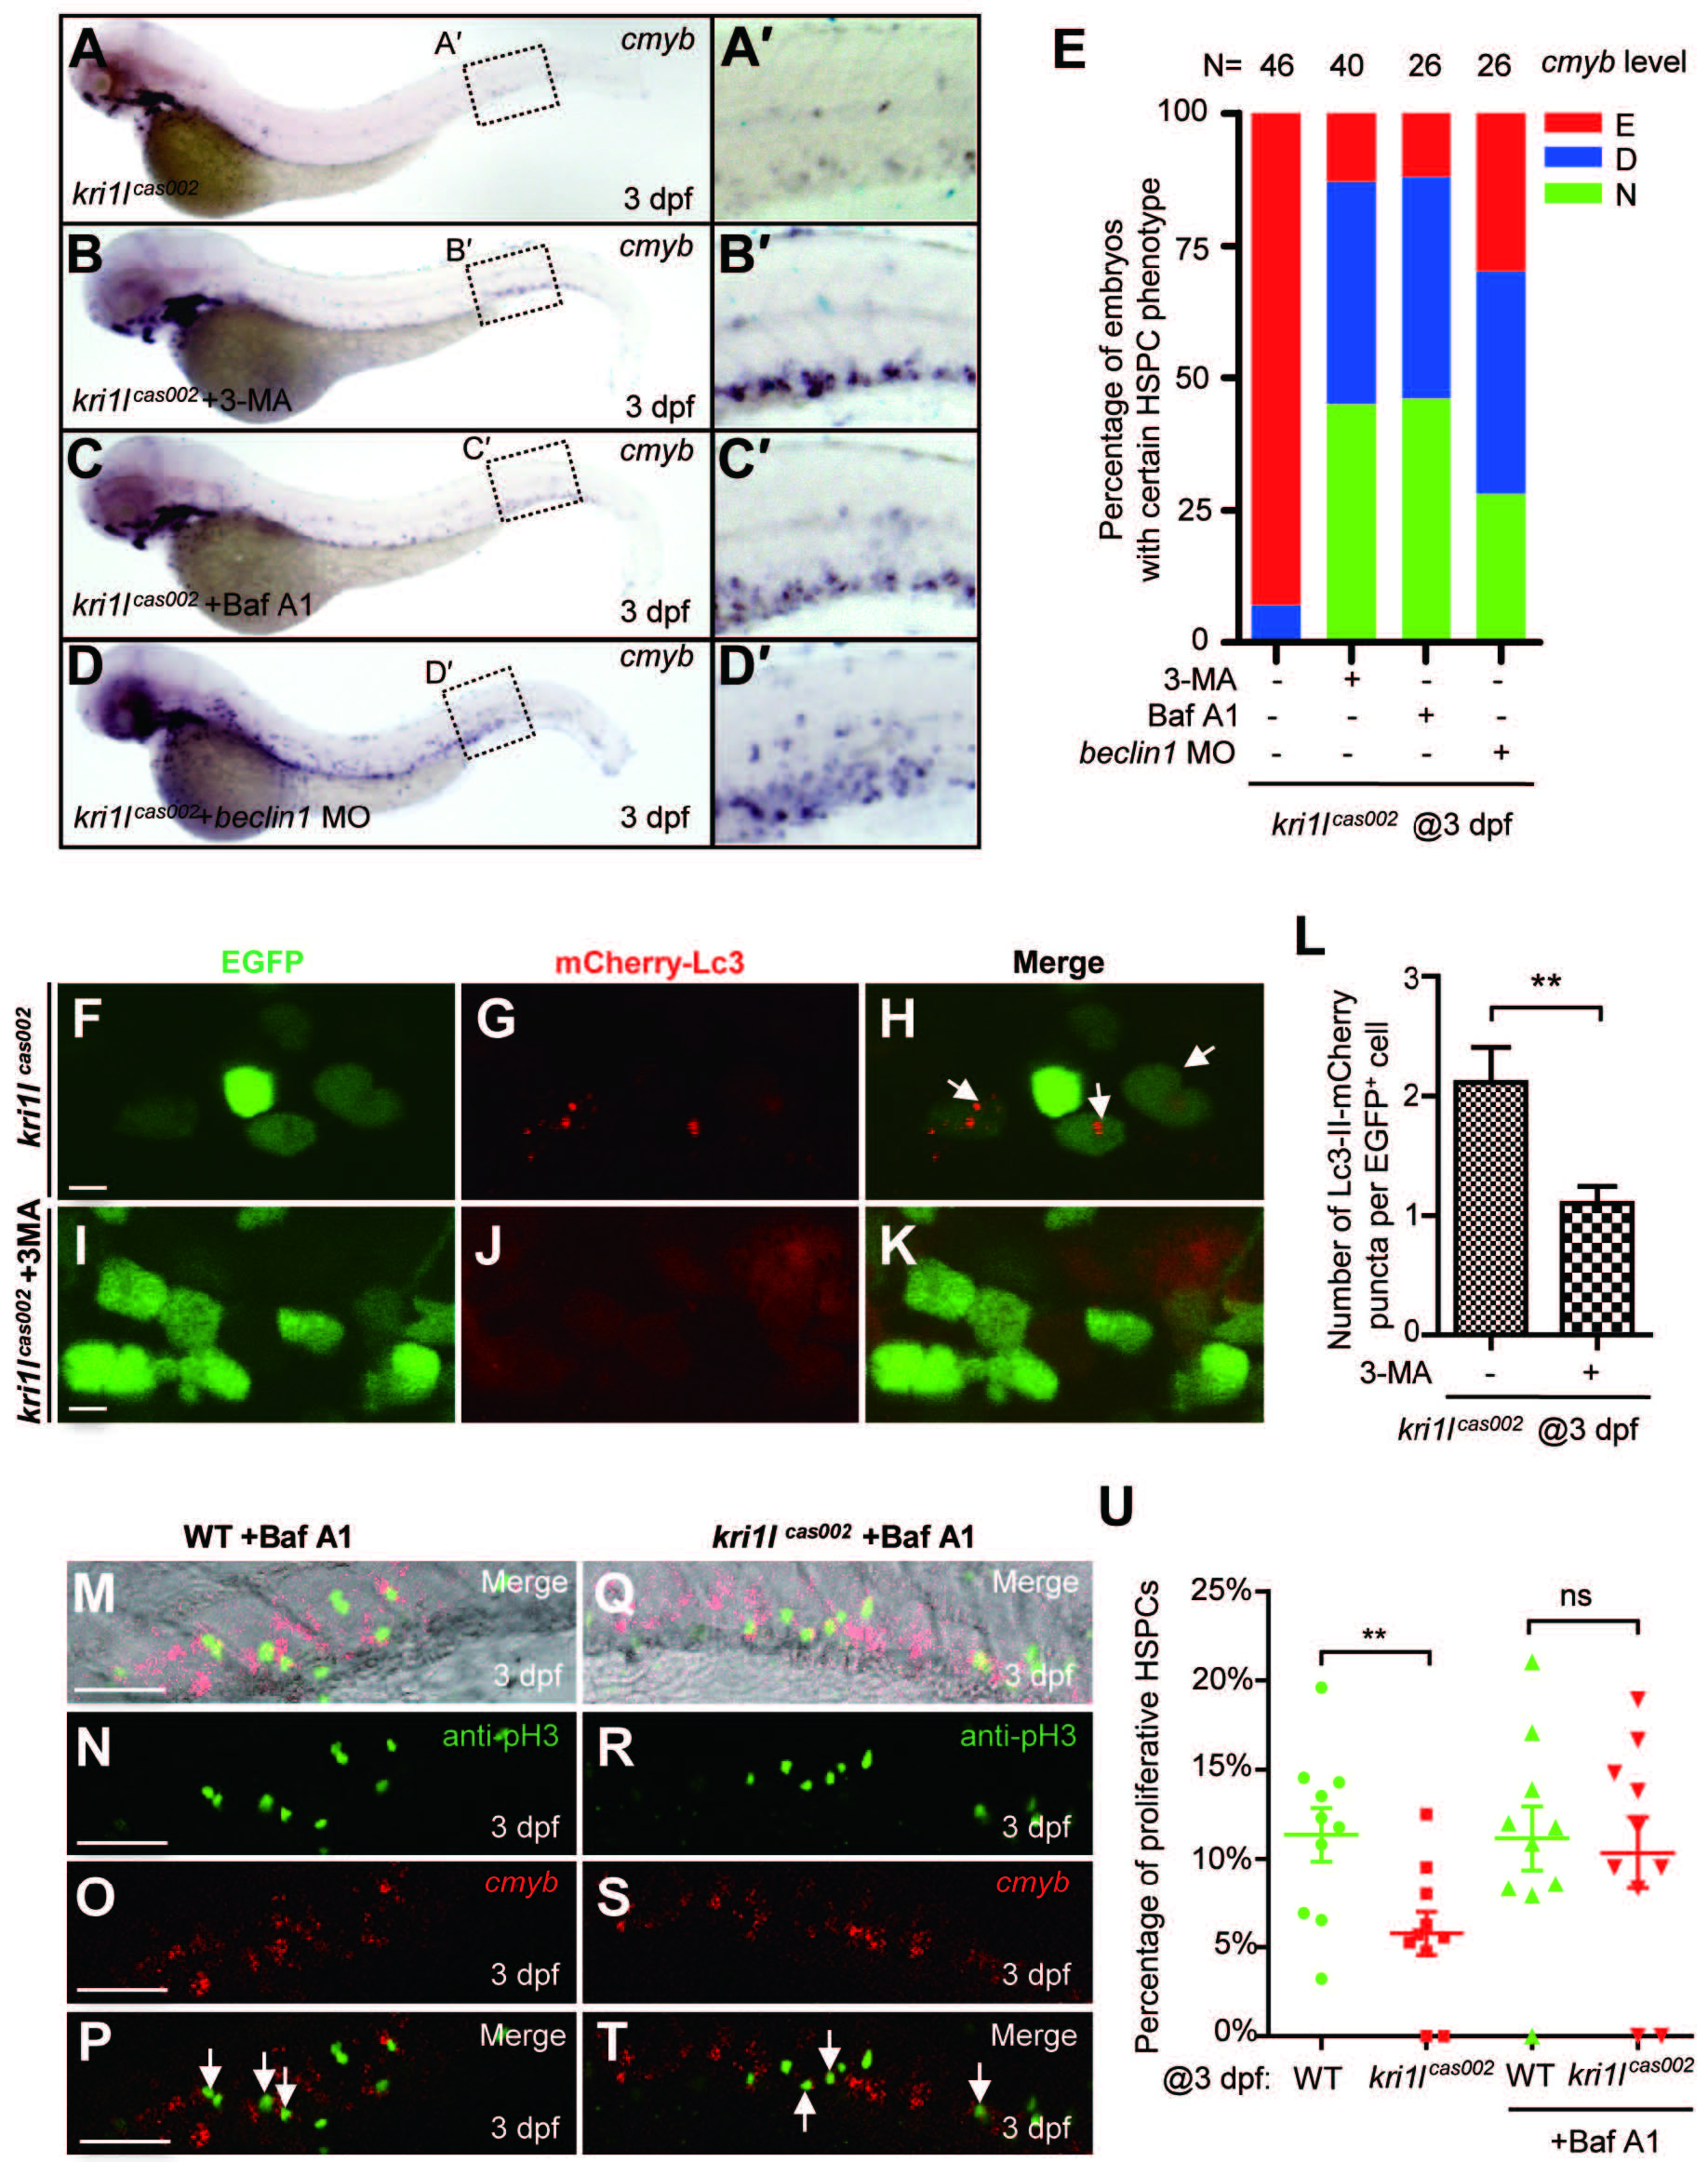
Fig. 5
Autophagy inhibitors prevent hematopoiesis failure in kri1lcas002 mutant embryos. (A-D) Representative images of cmyb expression pattern in kri1lcas002 embryos with or without treatment of autophagy inhibitors, or with microinjection of beclin1 MO. kri1lcas002 embryos were treated with 3-MA (10 mM) or Baf A1 (25 nM) from 36 hpf to 72 hpf. After cmyb WISH and imaging, all embryos were genotyped; the percentage of the rescue was calculated. 18 out of 40 mutant embryos treated with 3-MA are fully rescued, while 17 out of 40 mutant embryos are rescued partially. 12 out of 26 mutant embryos treated with Baf A1 are fully rescued, while 11 out of 26 mutant embryos are rescued partially. 7 out of 26 mutant embryos injected beclin1 MO are fully rescued, while 11 out of 26 mutant embryos are rescued partially. (E) Percentage of kri1lcas002 mutant embryos with classified hematopoiesis phenotype with or without treatment of autophagy inhibitors, or with microinjection of beclin1 MO. (F-K) 3-MA inhibits excessive autophagy in HSPCs in kri1lcas002 mutant embryos. Representative confocal images of mCherry-Lc3 puncta (autophagosomes) in kri1lcas002 mutant embryos in Tg (cmyb:egfp) transgenic background are shown. Scale bars, 5 µm. (L) Quantitative analysis of F-K. The numbers of autophagosomes are decreased in kri1lcas002 embryos with 3-MA treatment, p = 0.0037. (M-T) Baf A1 treatment restores HSPCs proliferation in kri1lcas002 mutant embryos. Double staining of cmyb RNA (red) and phospho-histone 3 (pH3) protein (green) in the CHT region of embryos at 3 dpf. M and Q show bright-field images overlaid with fluorescent staining. Scale bars, 50 µm. (U) Percentage of proliferative HSPCs in the CHT of kri1lcas002 mutant embryos and wild type siblings with or without Baf A1 treatment at 3 dpf N = 10. Without Baf A1 treatment, p = 0.0014; with Baf A1 treatment, P = 0.2344. Error bars represent SEM. **P≤ 0.01; ***P ≤ 0.001 (Student′s t-test).