
|
Fig. 3
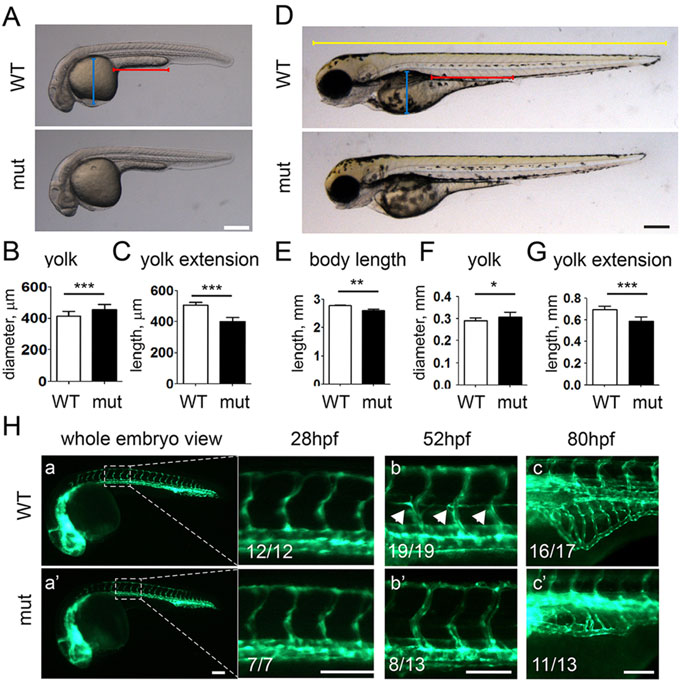
Development and angiogenesis in apoc2 mutant larvae. (A-C) Morphology of WT (n=11) and apoc2 mutant (mut, n=11) embryos at 30hpf. Results are mean±s.e.m.; ***P<0.001 (Student′s t-test). (D-G) Morphology of WT (n=11) and apoc2 mutant (n=10) embryos at 3.5dpf. Results are mean±s.e.m.; *P<0.05; **P<0.01; ***P<0.001 (Student′s t-test). The blue, red and yellow lengths highlighted in D were used to delineate the size of yolk, yolk extension and the body length, respectively. (H) Angiogenesis in fli1:EGFP WT and apoc2 mutant embryos at 28hpf (a,a′), 52hpf (b,b′) and 80hpf (c,c′). The numbers in the figure indicate the number of animals exhibiting the illustrated phenotype and the total number of animals. Scale bars: 200µm (A,D); 100µm (H).