
|
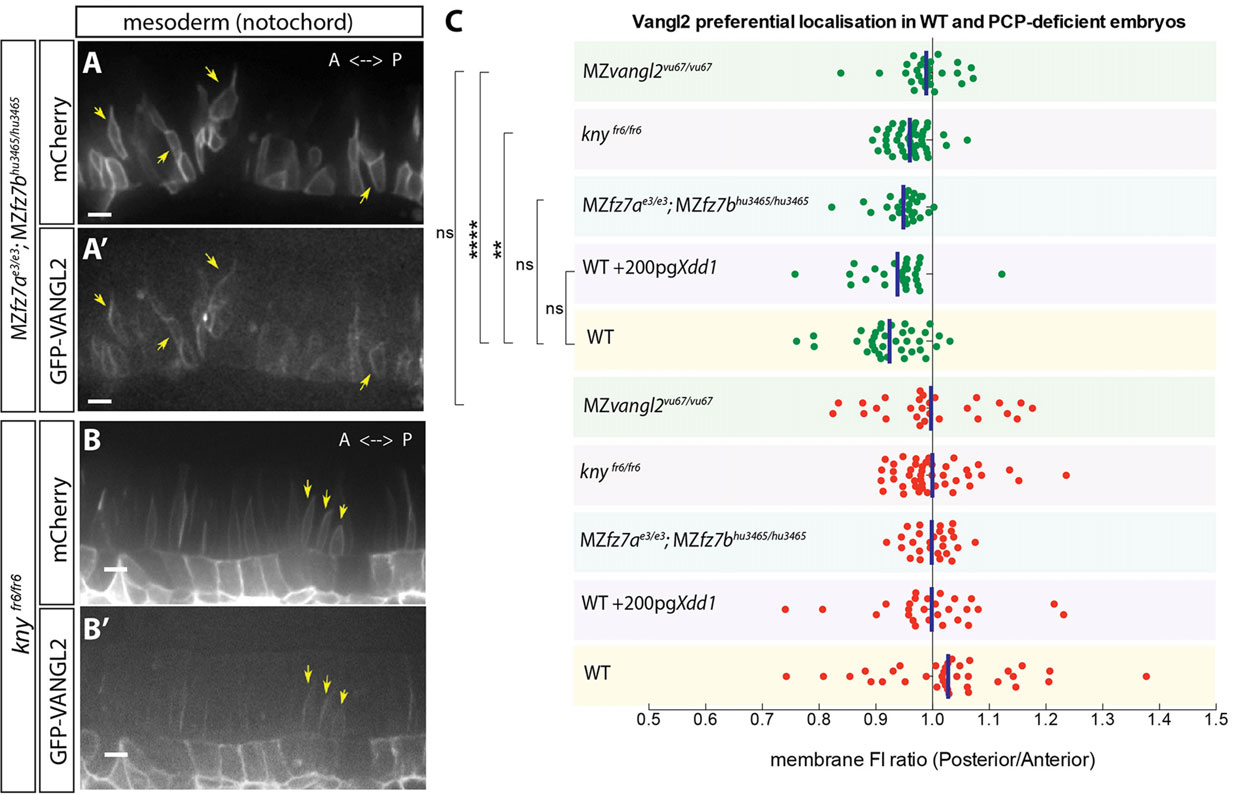
Fig. 8
Vangl2 membrane localization in embryos with defective PCP signaling. (A-B′) Live embryos mosaically expressing GFP-VANGL2 and mCherry. Arrows indicate individual cells showing anteriorly biased Vangl2 membrane localization. (C) Quantification of mGFP (green) and mCherry (red) posterior/anterior membrane FI ratios obtained by analyzing individual cells in the notochord of 5-6 s stage (11.7-12hpf) embryos in specified mutants or Xdd1 RNA-injected embryos. The data plot shows the quantification of either GFP-Vangl2 from Tg(vangl2:GFP-Vangl2) cells in MZvangl2vu67/vu67 and Xdd1-injected embryos, or of GFP-VANGL2 in MZfz7ae3/e3;MZfz7bhu3465/hu3465 and knyfr6/fr6 embryos. GFP-Vangl2 and GFP-VANGL2 quantification data are combined for the WT embryos. Blue bar indicates the average posterior/anterior FI ratio for each condition. **P<0.01, ****P<0.0001; ns, not significant; unpaired t-test with Welch′s correction. Scale bars: 10µm.