
|
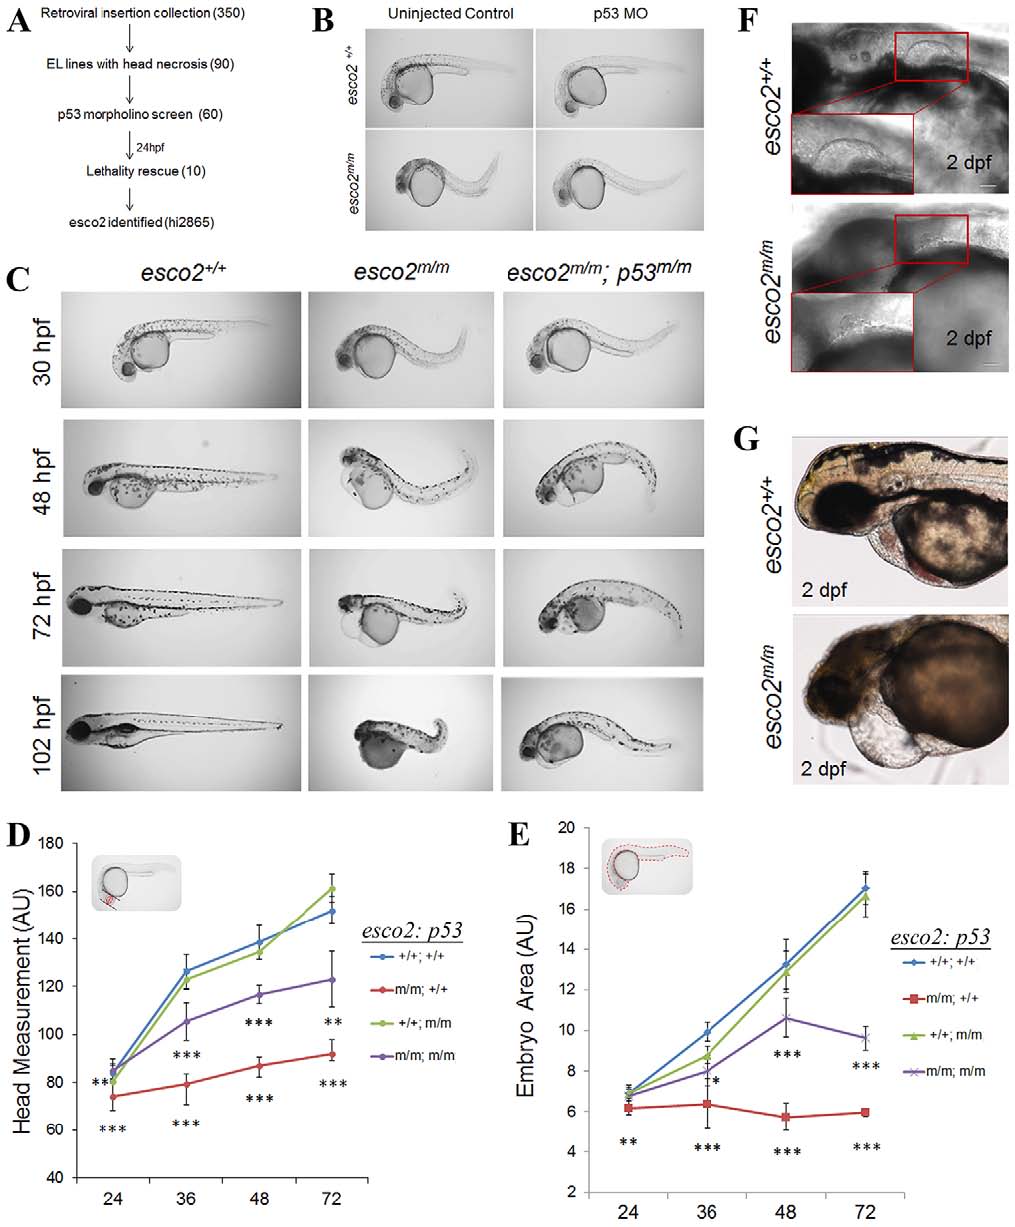
Fig. 1
Genetic screen identifies the retroviral insertion embryonic lethal mutant, hi2865. (A) Design of the screen used to identify insertion mutants exhibiting microcephaly and head necrosis, amongst 350 embryonic lethal (EL) mutants, that are rescued by morpholino (MO) knockdown of p53 (numbers in parentheses indicate the number of mutants at each stage) at 24hpf. (B) Brightfield images of a 24-hpf hi2865 sibling and homozygous mutant (henceforth esco2hi2865/hi2865 will be referred to as esco2m/m) embryos injected or uninjected with p53 MO. (C) esco2+/+, esco2m/m and esco2m/m; p53dzy7/dzy7 (henceforth p53dzy7/dzy7 will be referred to as p53m/m) gross morphological phenotypes between 30hpf and 102hpf (4dpf). (D) Head measurements and (E) embryo area of esco2+/+, esco2m/m, esco2+/+; p53/ and esco2m/m; p53/ were measured using ImageJ in arbitrary units (n=5/genotype, mean±s.d., *P<0.05, **P<0.01, ***P<0.001; significance values shown below the red line are derived from comparing esco2m/m versus esco2+/+; significance values shown below the purple line are from comparing esco2m/m; p53m/m versus esco2m/m). Insets in each graph depict the measurement parameters highlighted in red. (F,G) DIC images depict fin and heart defects, respectively, in esco2m/m. Insets detail normal fin and remnant fin bud. Scale bars: 50µm.