
|
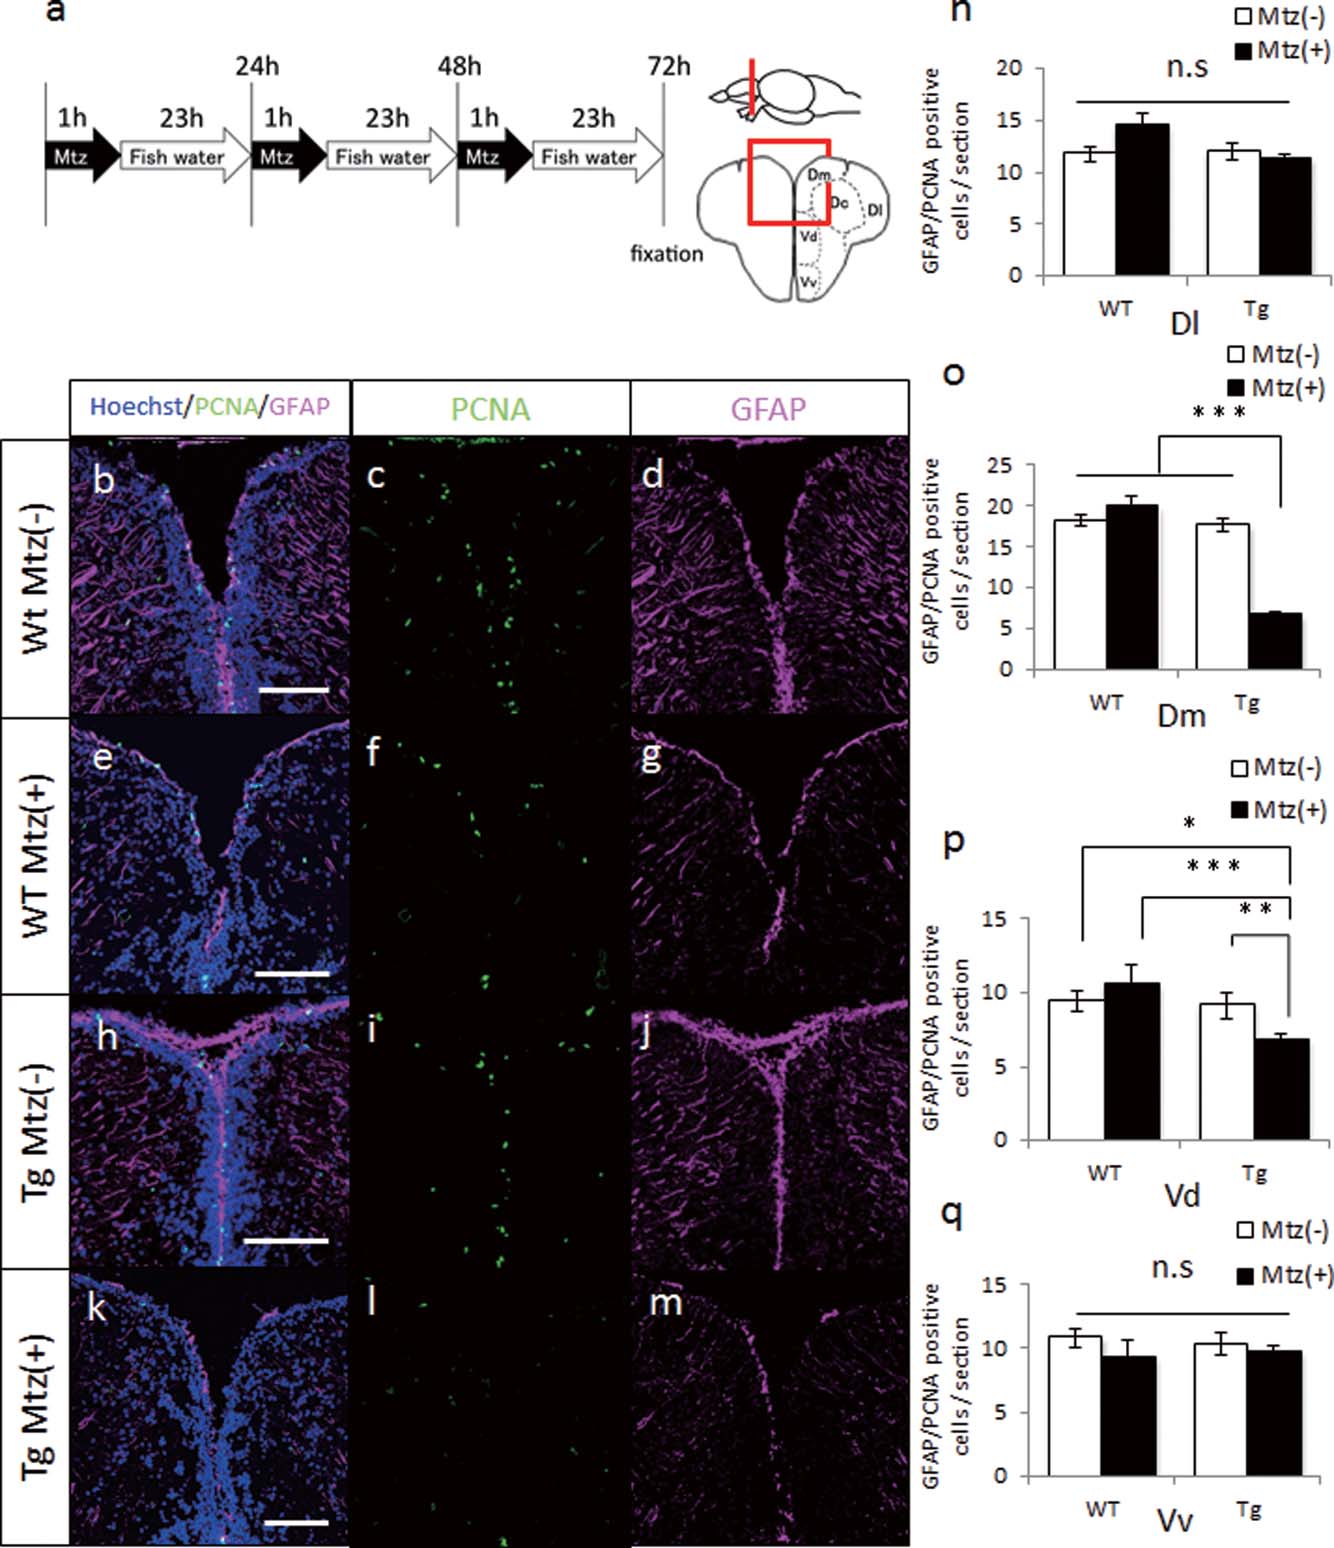
Fig. 4
RGC-ablation reduces proliferative RGCs in the adult zebrafish brain. a: Mtz treatment schedule for RGC-specific ablation. b–g: Expression of PCNA and GFAP in WT without (b–d) or with Mtz treatment (e–g). Sections of the telencephalon of WT fish brains were stained with anti-PCNA (green) and anti-GFAP (red) antibodies. Nuclei were stained with Hoechst (blue). h–m: Expression of PCNA and GFAP in Tg(gfap:Gal4FF;UAS:nfsB-mcherry) zebrafish without (h–j) or with Mtz treatment (k–m). Sections of the telencephalon of Tg fish were stained with anti-PCNA (green) and anti-GFAP (red) antibodies. Nuclei were stained with Hoechst (blue). n–q: Quantification of PCNA(+)/GFAP(+) cells in WT and Tg zebrafish with or without Mtz treatment. *P < 0.05, **P < 0.01, and ***P < 0.001. Data are expressed as mean ± SEM; n = 3. Scale bars, 100 µm in b, e, h, and k.