
|
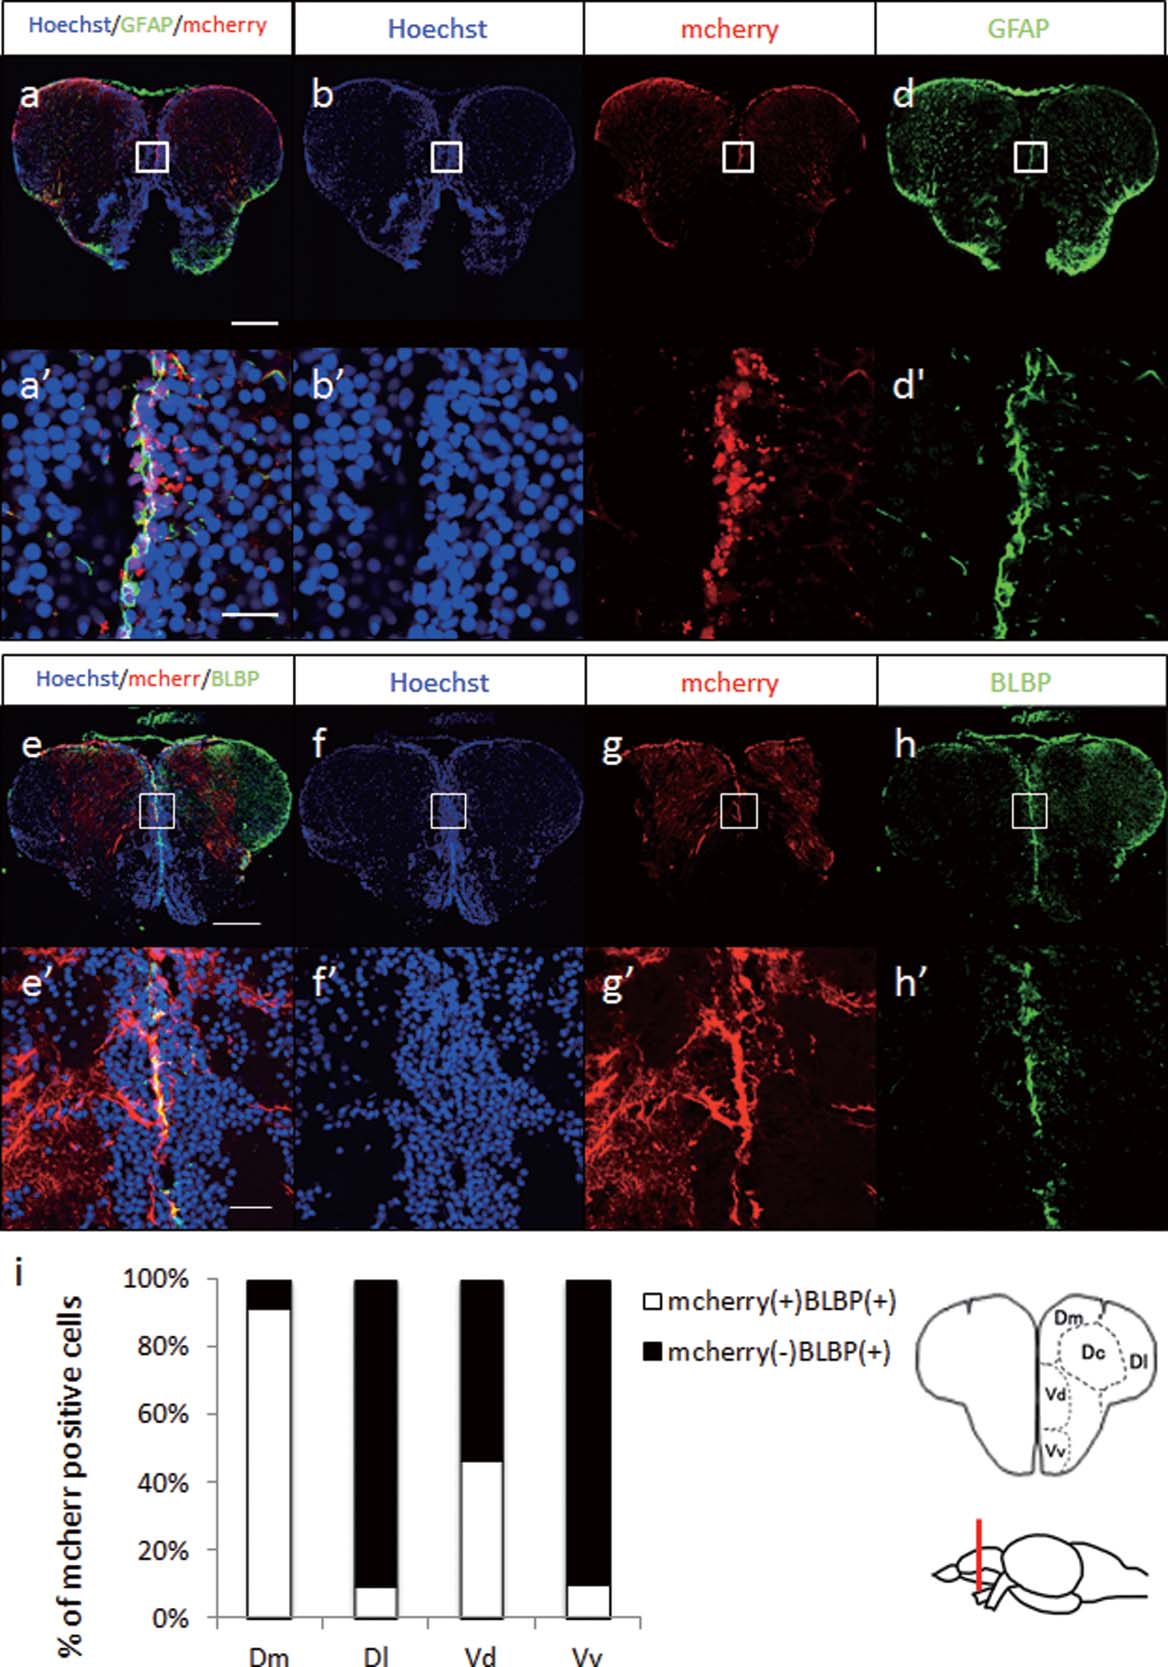
Fig. 2
RGC-specific NTR expression in the adult zebrafish brain. a–d: Expression of mcherry and GFAP in the adult Tg(gfap:Gal4FF;UAS:nfsB-mcherry) telencephalon. Sections of the telencephalon of Tg fish were stained with anti-GFAP (green) antibody. Nuclei were stained with Hoechst (blue). a′–d′: Magnified images of the white-boxed areas above. e–h: Expression of mcherry and BLBP in the adult Tg(gfap:Gal4FF;UAS:nfsB-mcherry) telencephalon. Sections of the telencephalon of Tg fish were stained with anti-BLBP (green) antibody. Nuclei were stained with Hoechst (blue). e′–h′: Magnified images of the white-boxed areas above. i: Colocalization of mcherry with BLBP in the telencephalon. The percentage of mcherry(+)/BLBP(+) is 91.27 ± 2.02% in the Dm domain, 9.61 ± 1.47% in the Dl domain, 43.61 ± 4.51% in the Vd domain, and 8.71 ± 5.98% in the Vv domain. Data are expressed as mean ± SEM; n = 3. Scale bars, 200 µm in a and e, 20 µm in a′ and e′.