
|
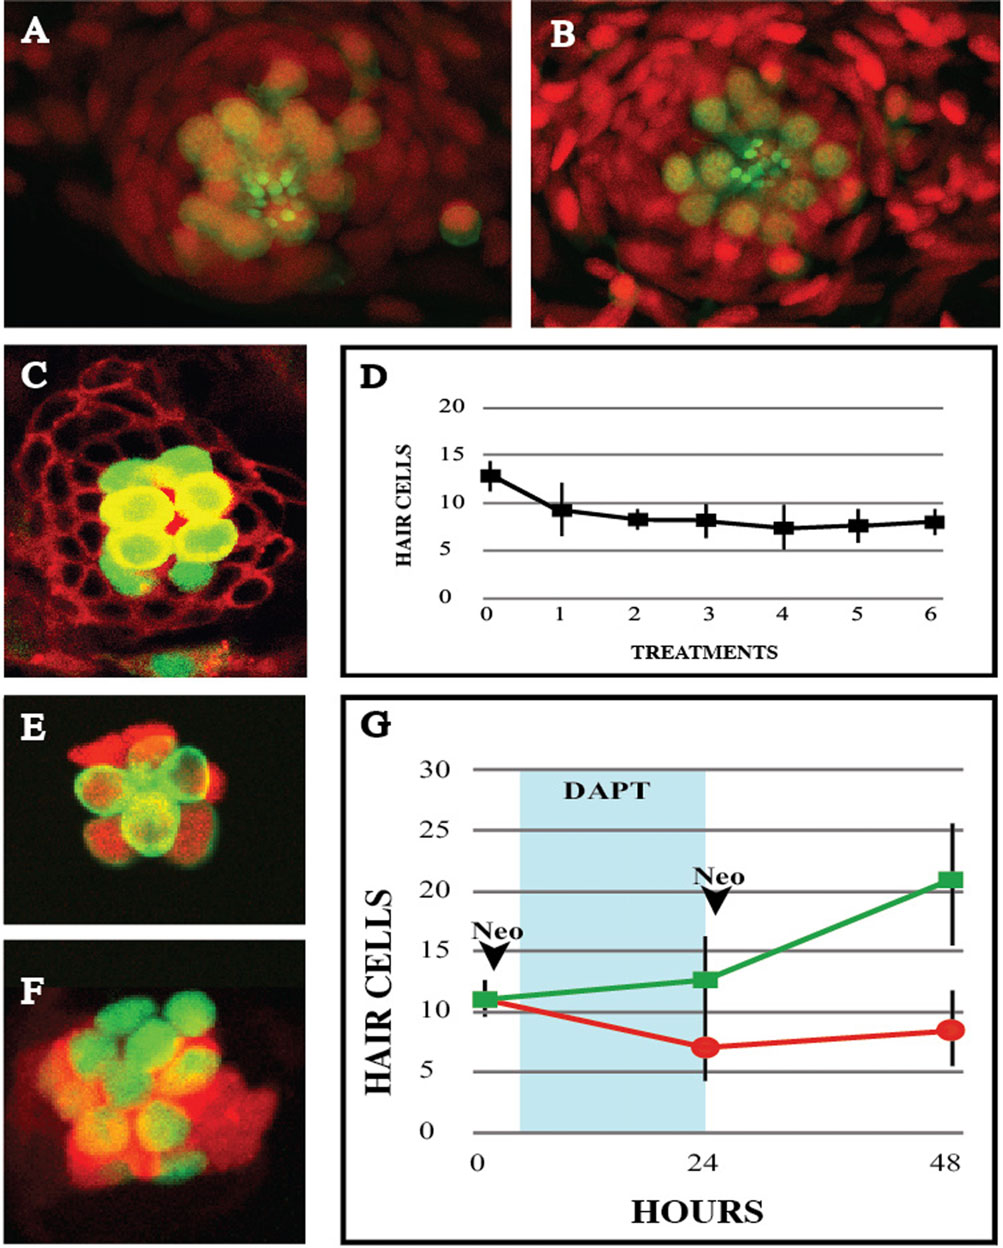
Fig. 3
Hair-cell regeneration after recurrent damage. (A-B) Confocal images of a Tg[ET(krt4:EGFP)sqet4] (green) larval neuromast labeled with DAPI (red) showing hair cells (A) before neomycin treatment and (B) 72h after the 6th treatment. (C) Image of a Tg[ET(krt4:EGFP)sqet4] (green) larval neuromast counterstained for cellular membranes (red) 24hpt, with 8 hair cells. (D) Graph depicting the number of hair cells per neuromast 24h after each neomycin treatment, over the course of 6 consecutive treatments. (E-F) A neuromast from a neomycin-treated larva Tg[Atoh1a:dTomato (red) ; ET(krt4:EGFP)sqet4 (green)] without (E), and with Notch inhibition with DAPT (F), showing more numerous hair cells and stronger and broader Atho1a expression. (G) Graph showing number of hair cells per neuromast 24h after two neomycin treatments with (green) and without (red) inhibition of Notch. DAPT incubation period is shadowed in blue. Results are mean±s.d. Time points: 0h N=5 neuromasts (5 animals), 24h N=8 neuromasts (8 animals), 48h N=4 neuromasts (4 animals).