
|
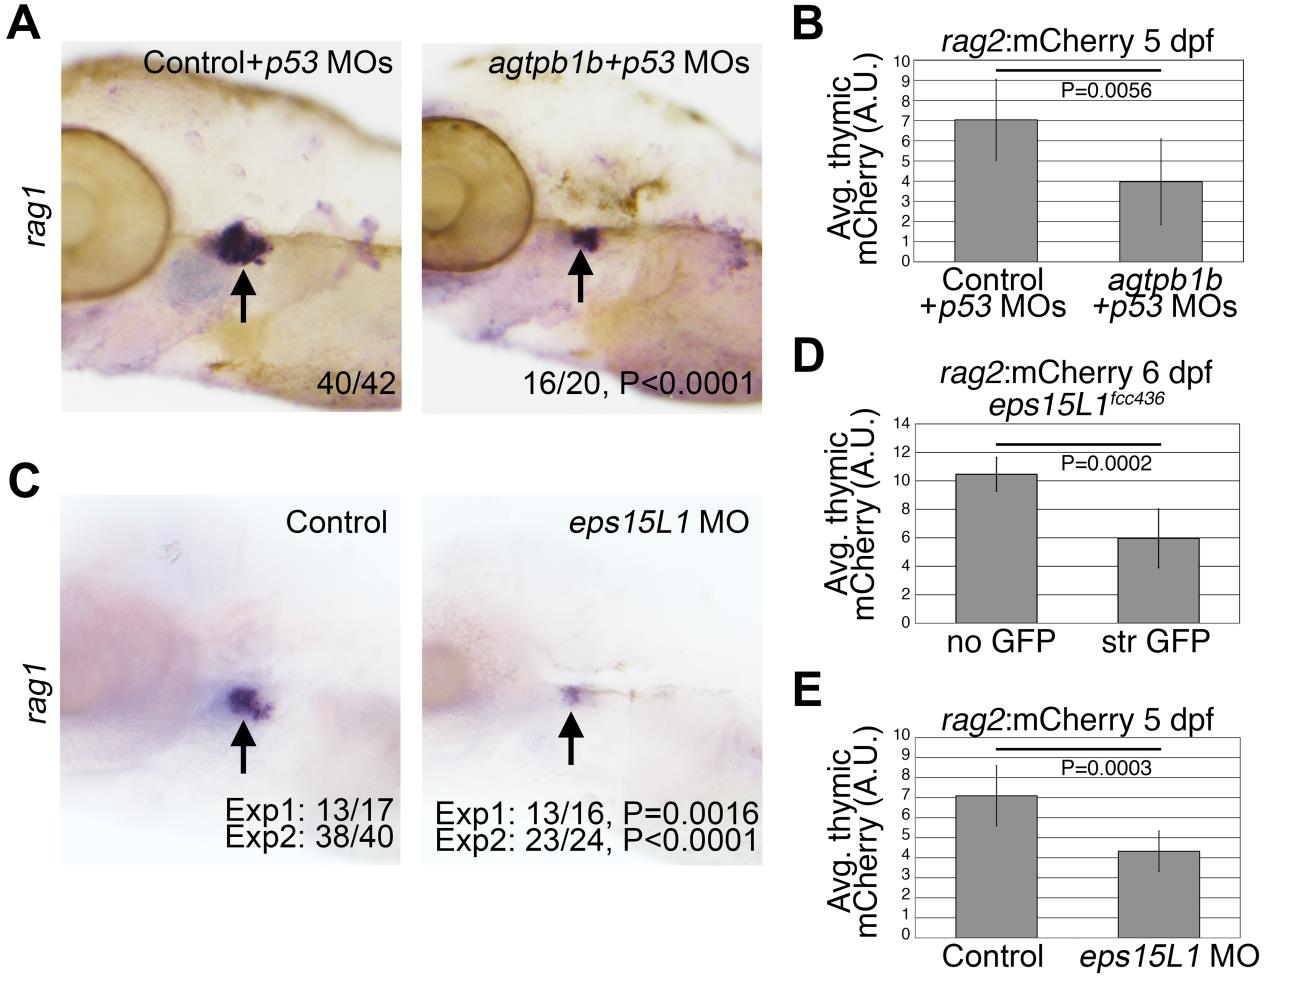
Fig. S9 Deficiency for agtpbp1 and eps15L1 inhibits lymphoid development.
(A) WISH of rag1 in 5 dpf control and agtpbp1 morphants co-injected with p53 morpholino. N is indicated. Images show lateral views of the left side of the head. Arrows indicate rag1-expressing cells in the thymus. (B) Levels of rag2:mCherry transgene expression in the thymus of 5 dpf control and agtpbp1 morphants. Images of mCherry (B,D,E) in siblings were acquired using identical exposure settings. Fiji was used to quantify the whole mount expression from the acquired images (shown in S10 Fig). (C) WISH of rag1 in 5 dpf control and eps15L1 morphants. N is indicated. Two independent experiments were performed. Images show lateral views of the left side of the head. Arrows indicate rag1-expressing cells in the thymus. (D-E) Quantitation of the rag2:mCherry transgene expression in the thymus in lines eps15L1fcc436-P1 (436) siblings at 6dpf (D) and control and eps15L1 morphants at 5 dpf (E). P values for mCherry quantitation were determined using two-tailed Student’s T-test; P values for WISH were determined using Fisher’s exact test.