
Image
|
Figure Caption
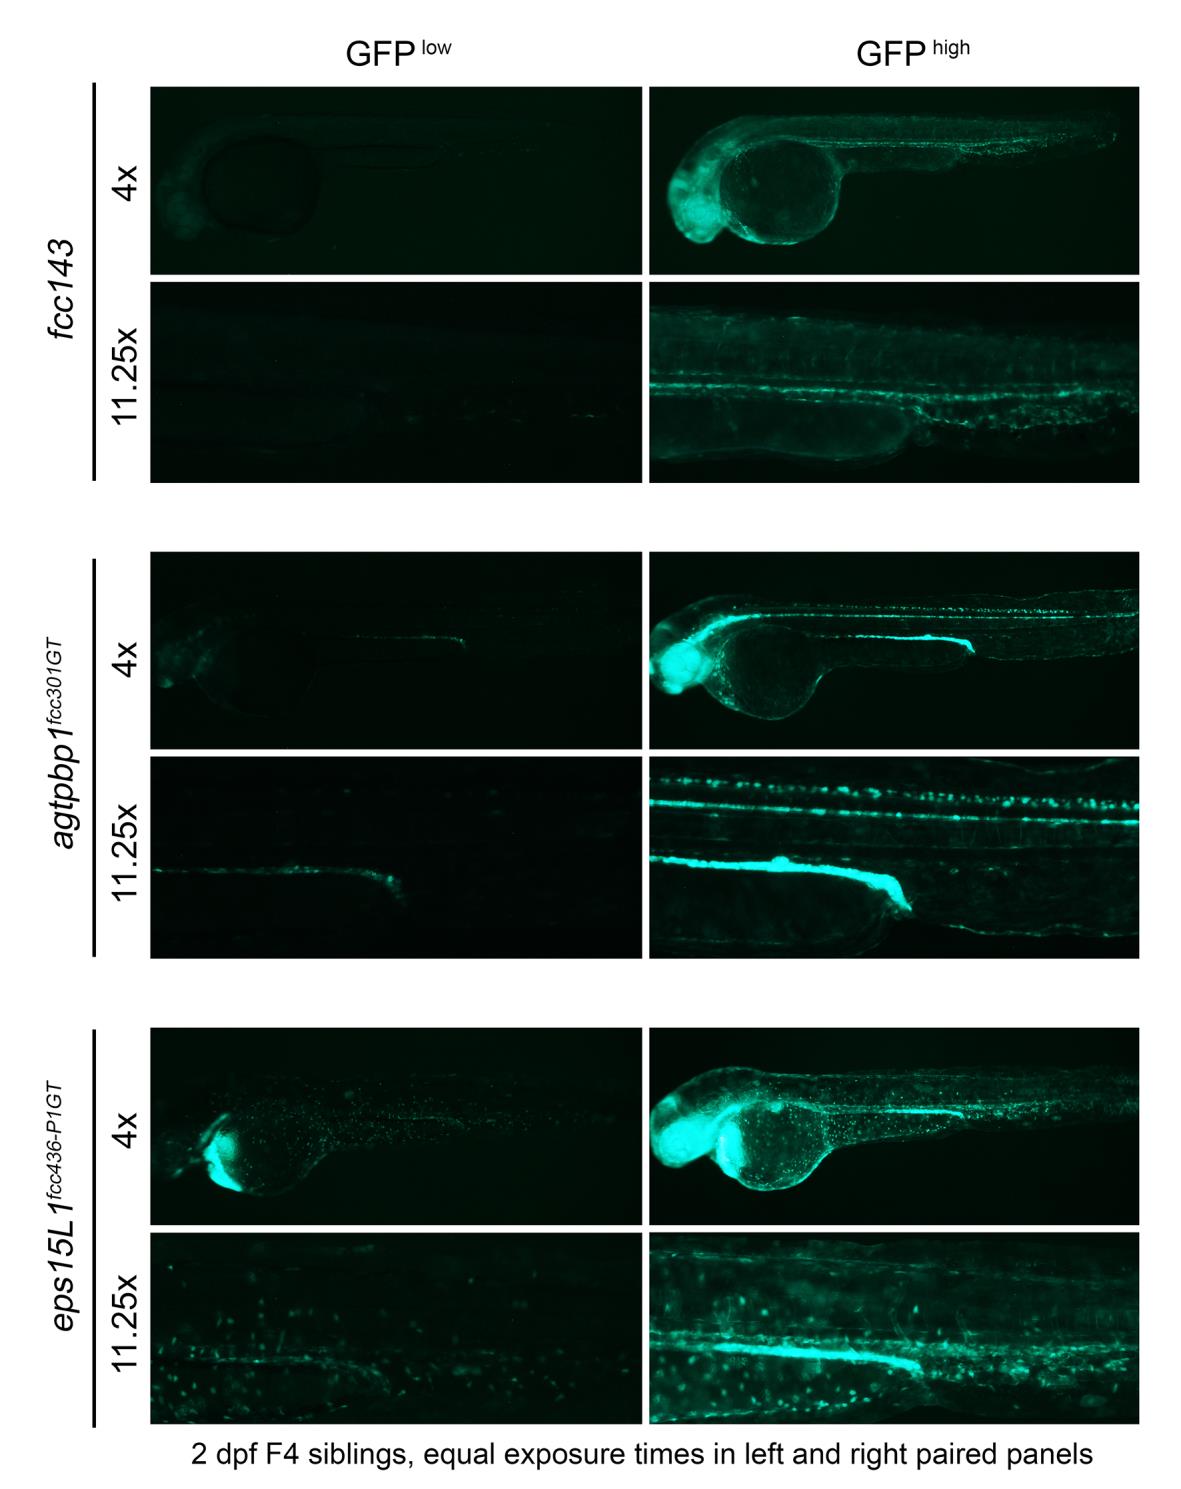
Fig. S6 Comparison of GFP expression levels in fcc143, agtpbp1 and eps15L1 gene-trap lines.
Images of representative 2 dpf siblings displaying low and high levels of GFP were acquired using the same exposure parameters for a given magnification.
Acknowledgments
This image is the copyrighted work of the attributed author or publisher, and
ZFIN has permission only to display this image to its users.
Additional permissions should be obtained from the applicable author or publisher of the image.
Full text @ PLoS One