
Image
|
Figure Caption
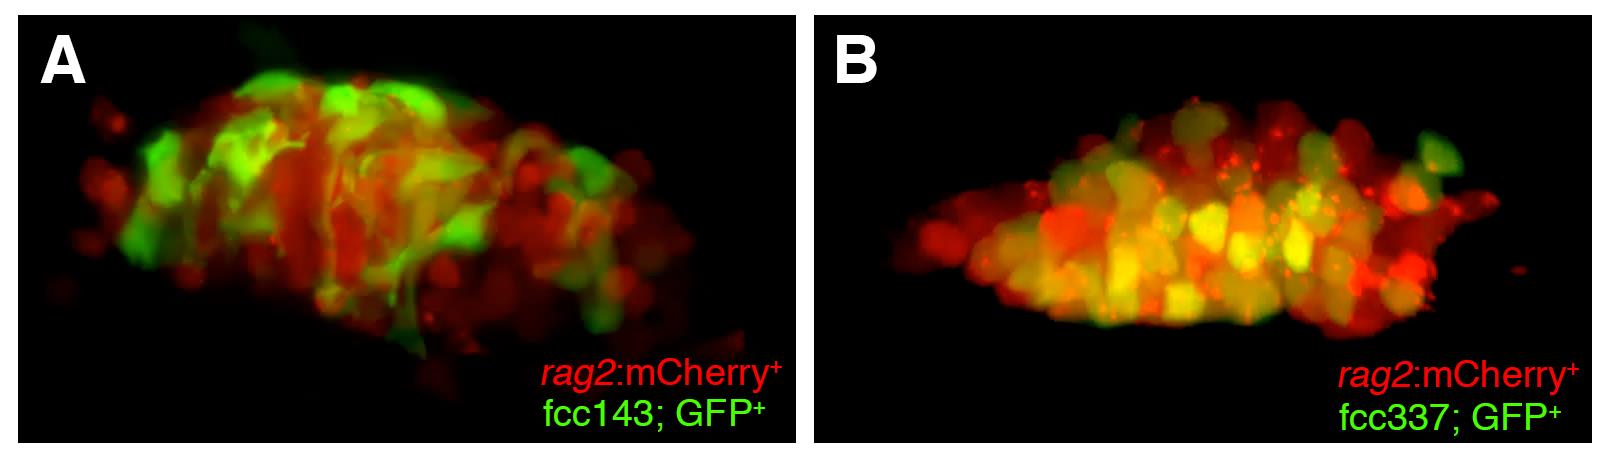
Fig. S4 Confocal analysis of the localization of gene-trap GFP+ cells compared to transgenic (tg) rag2:mCherry lymphoid cells.
(A) GFP+ cells in the thymus of 6 dpf line fcc143 embryos are distinct from, and surround, rag2:mCherry lymphoid cells. (B) Coexpression of line fcc337 GFP with transgene rag2:mCherry in a thymus of 6 dpf embryos. Yellow color = coexpression.
Acknowledgments
This image is the copyrighted work of the attributed author or publisher, and
ZFIN has permission only to display this image to its users.
Additional permissions should be obtained from the applicable author or publisher of the image.
Full text @ PLoS One