
|
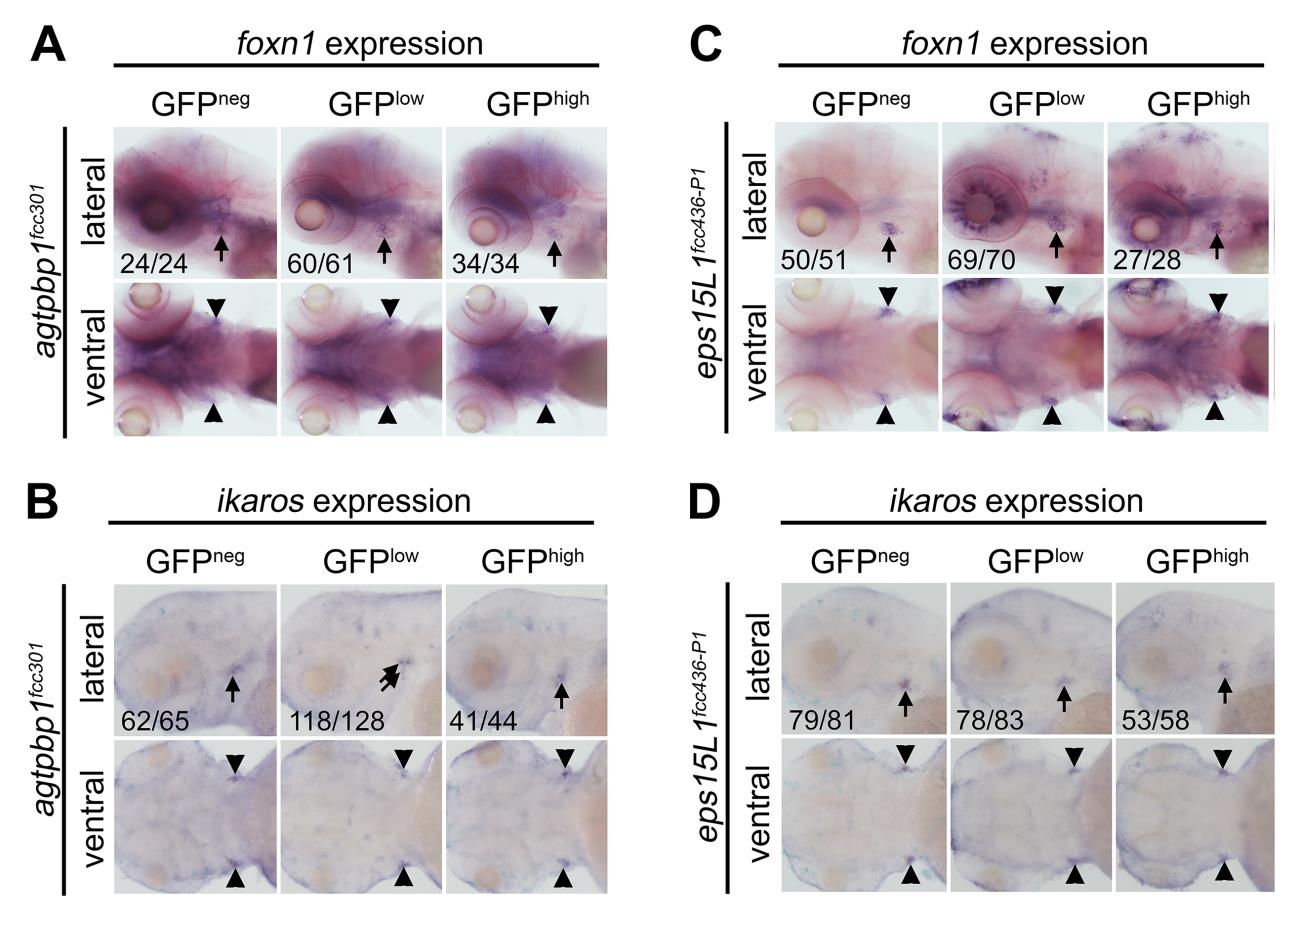
Fig. S11 Agtpbp1 and eps15L1 mutants display normal thymic foxn1 and ikaros expression patterns.
(A) WISH of foxn1 in 5 dpf agtpbp1fcc301 siblings sorted prior to fixation by their level of GFP expression, although there was a range of GFP expression levels in this line. (B) WISH of ikaros in 3 dpf agtpbp1fcc301 siblings separated prior to fixation based on their GFP expression level. (C) WISH of foxn1 in 5 dpf eps15L11fcc436-P1 siblings displaying the indicated GFP expression level. (D) WISH of ikaros in 3 dpf eps15L11fcc436-P1 siblings sorted prior to fixation by their level of GFP expression. Orientation, GFP expression levels and N are indicated. Neg = negative. Black arrows/arrowheads indicate WISH+ cells in the thymus.