
Image
|
Figure Caption
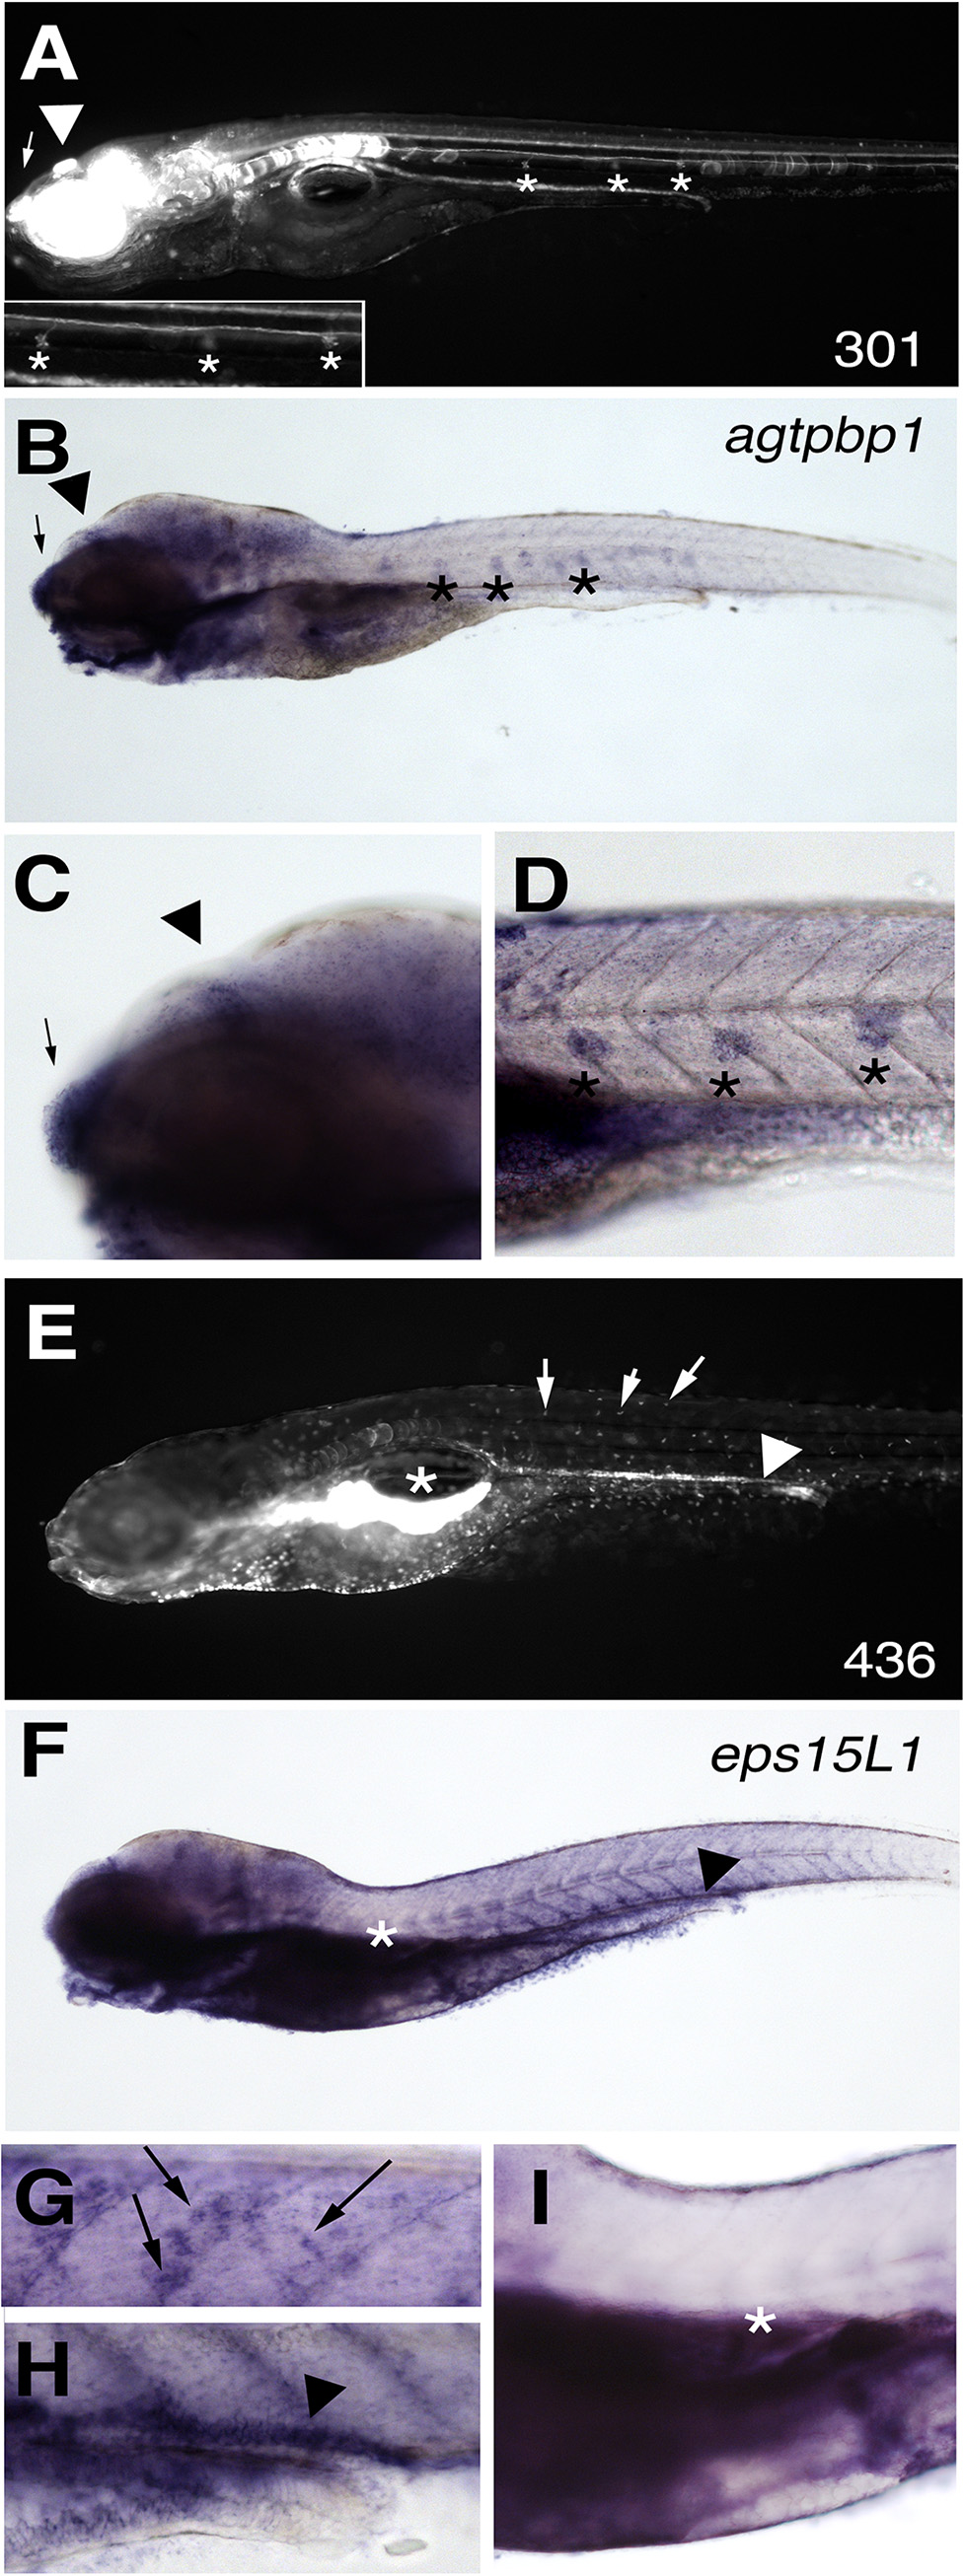
Fig. 5 Endogenous gene expression matches the gene-trap GFP expression pattern for agtpbp1 and eps15L1 lines.
(A) The GFP pattern in a representative 6 dpf embryo from the agtpbp1fcc301 line. (B-D) WISH of agtpbp1 at 6 dpf. Lateral line cells (*), epiphysis (arrowhead) and nasal pit (arrow) are indicated. (C-D) Magnified views of regions of the embryo shown in B. (E) The GFP pattern in a representative 6 dpf embryo from line eps15L1fcc436. (F-I) WISH of eps15L1 at 6 dpf. Pancreas (under *), kidney (arrowhead) and skin cells (arrows) are indicated. (G-I) Magnified views of regions of the embryo shown in F.
Figure Data
Acknowledgments
This image is the copyrighted work of the attributed author or publisher, and
ZFIN has permission only to display this image to its users.
Additional permissions should be obtained from the applicable author or publisher of the image.
Full text @ PLoS One