
|
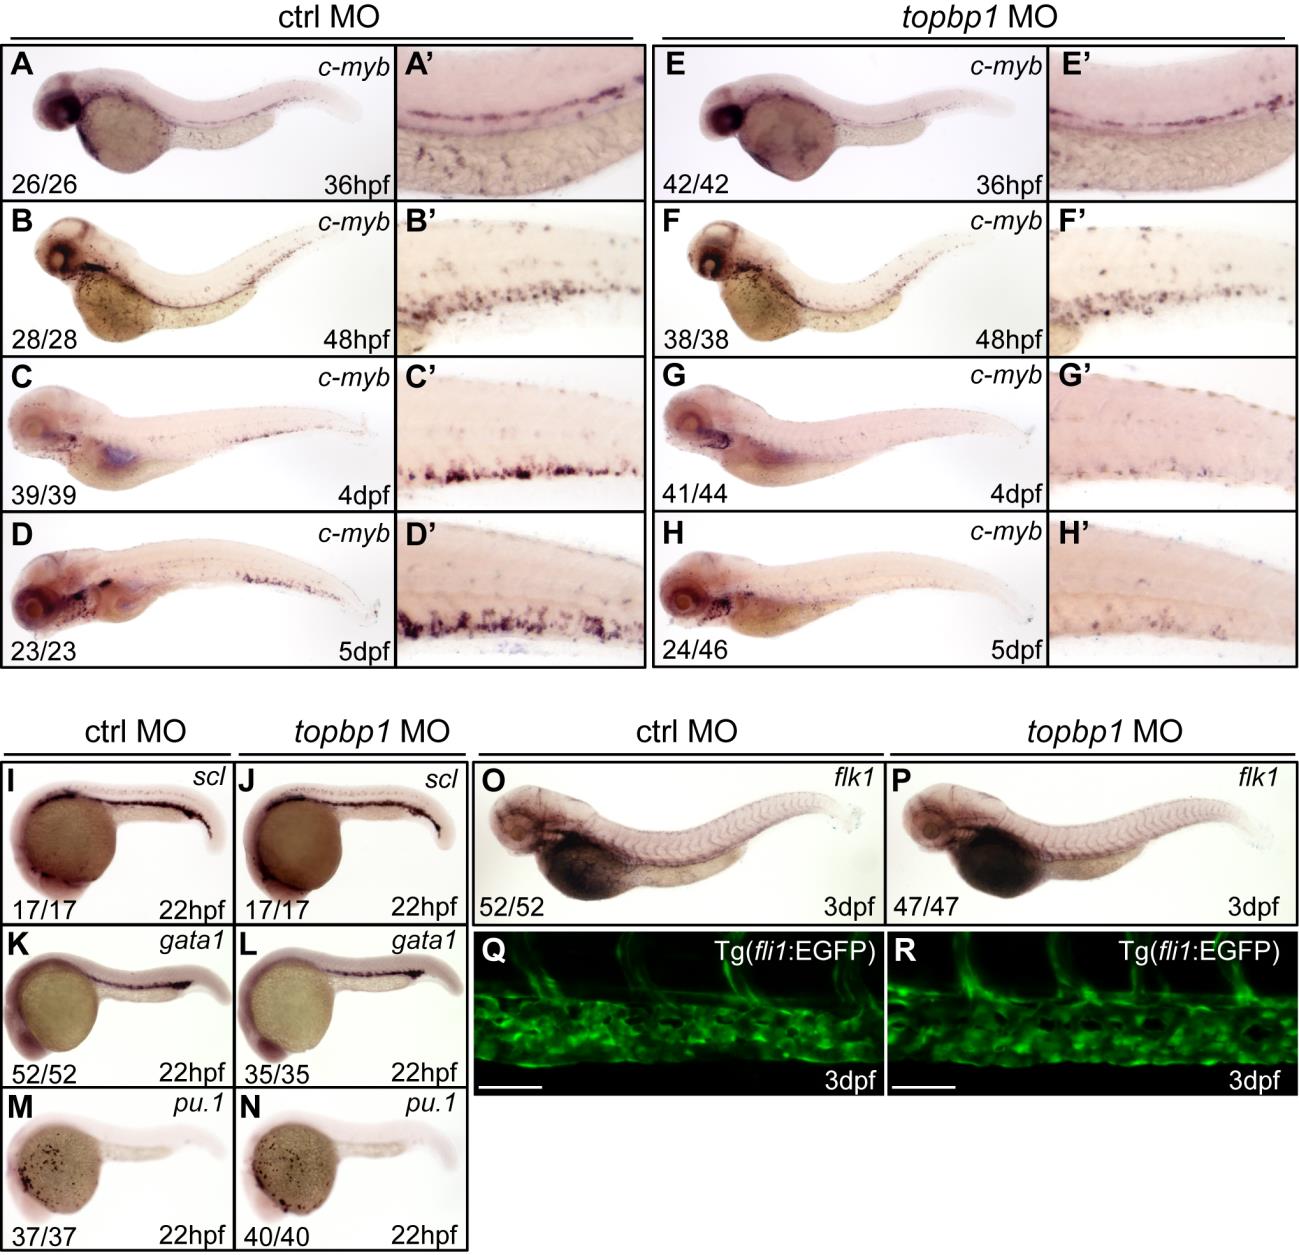
Fig. S4 The HSPC formation, primitive hematopoiesis and vascular morphogenesis are normal in topbp1 morphants.
(A-H′) Time-course analysis of c-myb expression in control and topbp1 morphants (1.6pg MO) from 36hpf to 5dpf. In topbp1 morphants, the c-myb expression is normal at 36hpf and 48hpf, but is decreased at 4dpf and 5dpf. The penetrance of the indicated phenotype is shown in the bottom left of each panel. (A′-H′) Enlarged detail of c-myb WISH analysis in the CHT region. (I-P) WISH analysis of scl, gata1 and pu.1 at 22hpf, or flk1 at 3dpf in control and topbp1 morphants (1.6pg MO). The primitive hematopoiesis and vascular system are normal in topbp1 morphants. (Q-R) Live imaging analysis of vascular plexus in the CHT region in control or topbp1 morphants within Tg(fli1: EGFP) background at 3dpf. The vascular plexus is normal in topbp1 morphants. Scale bars represent 50µm.