
|
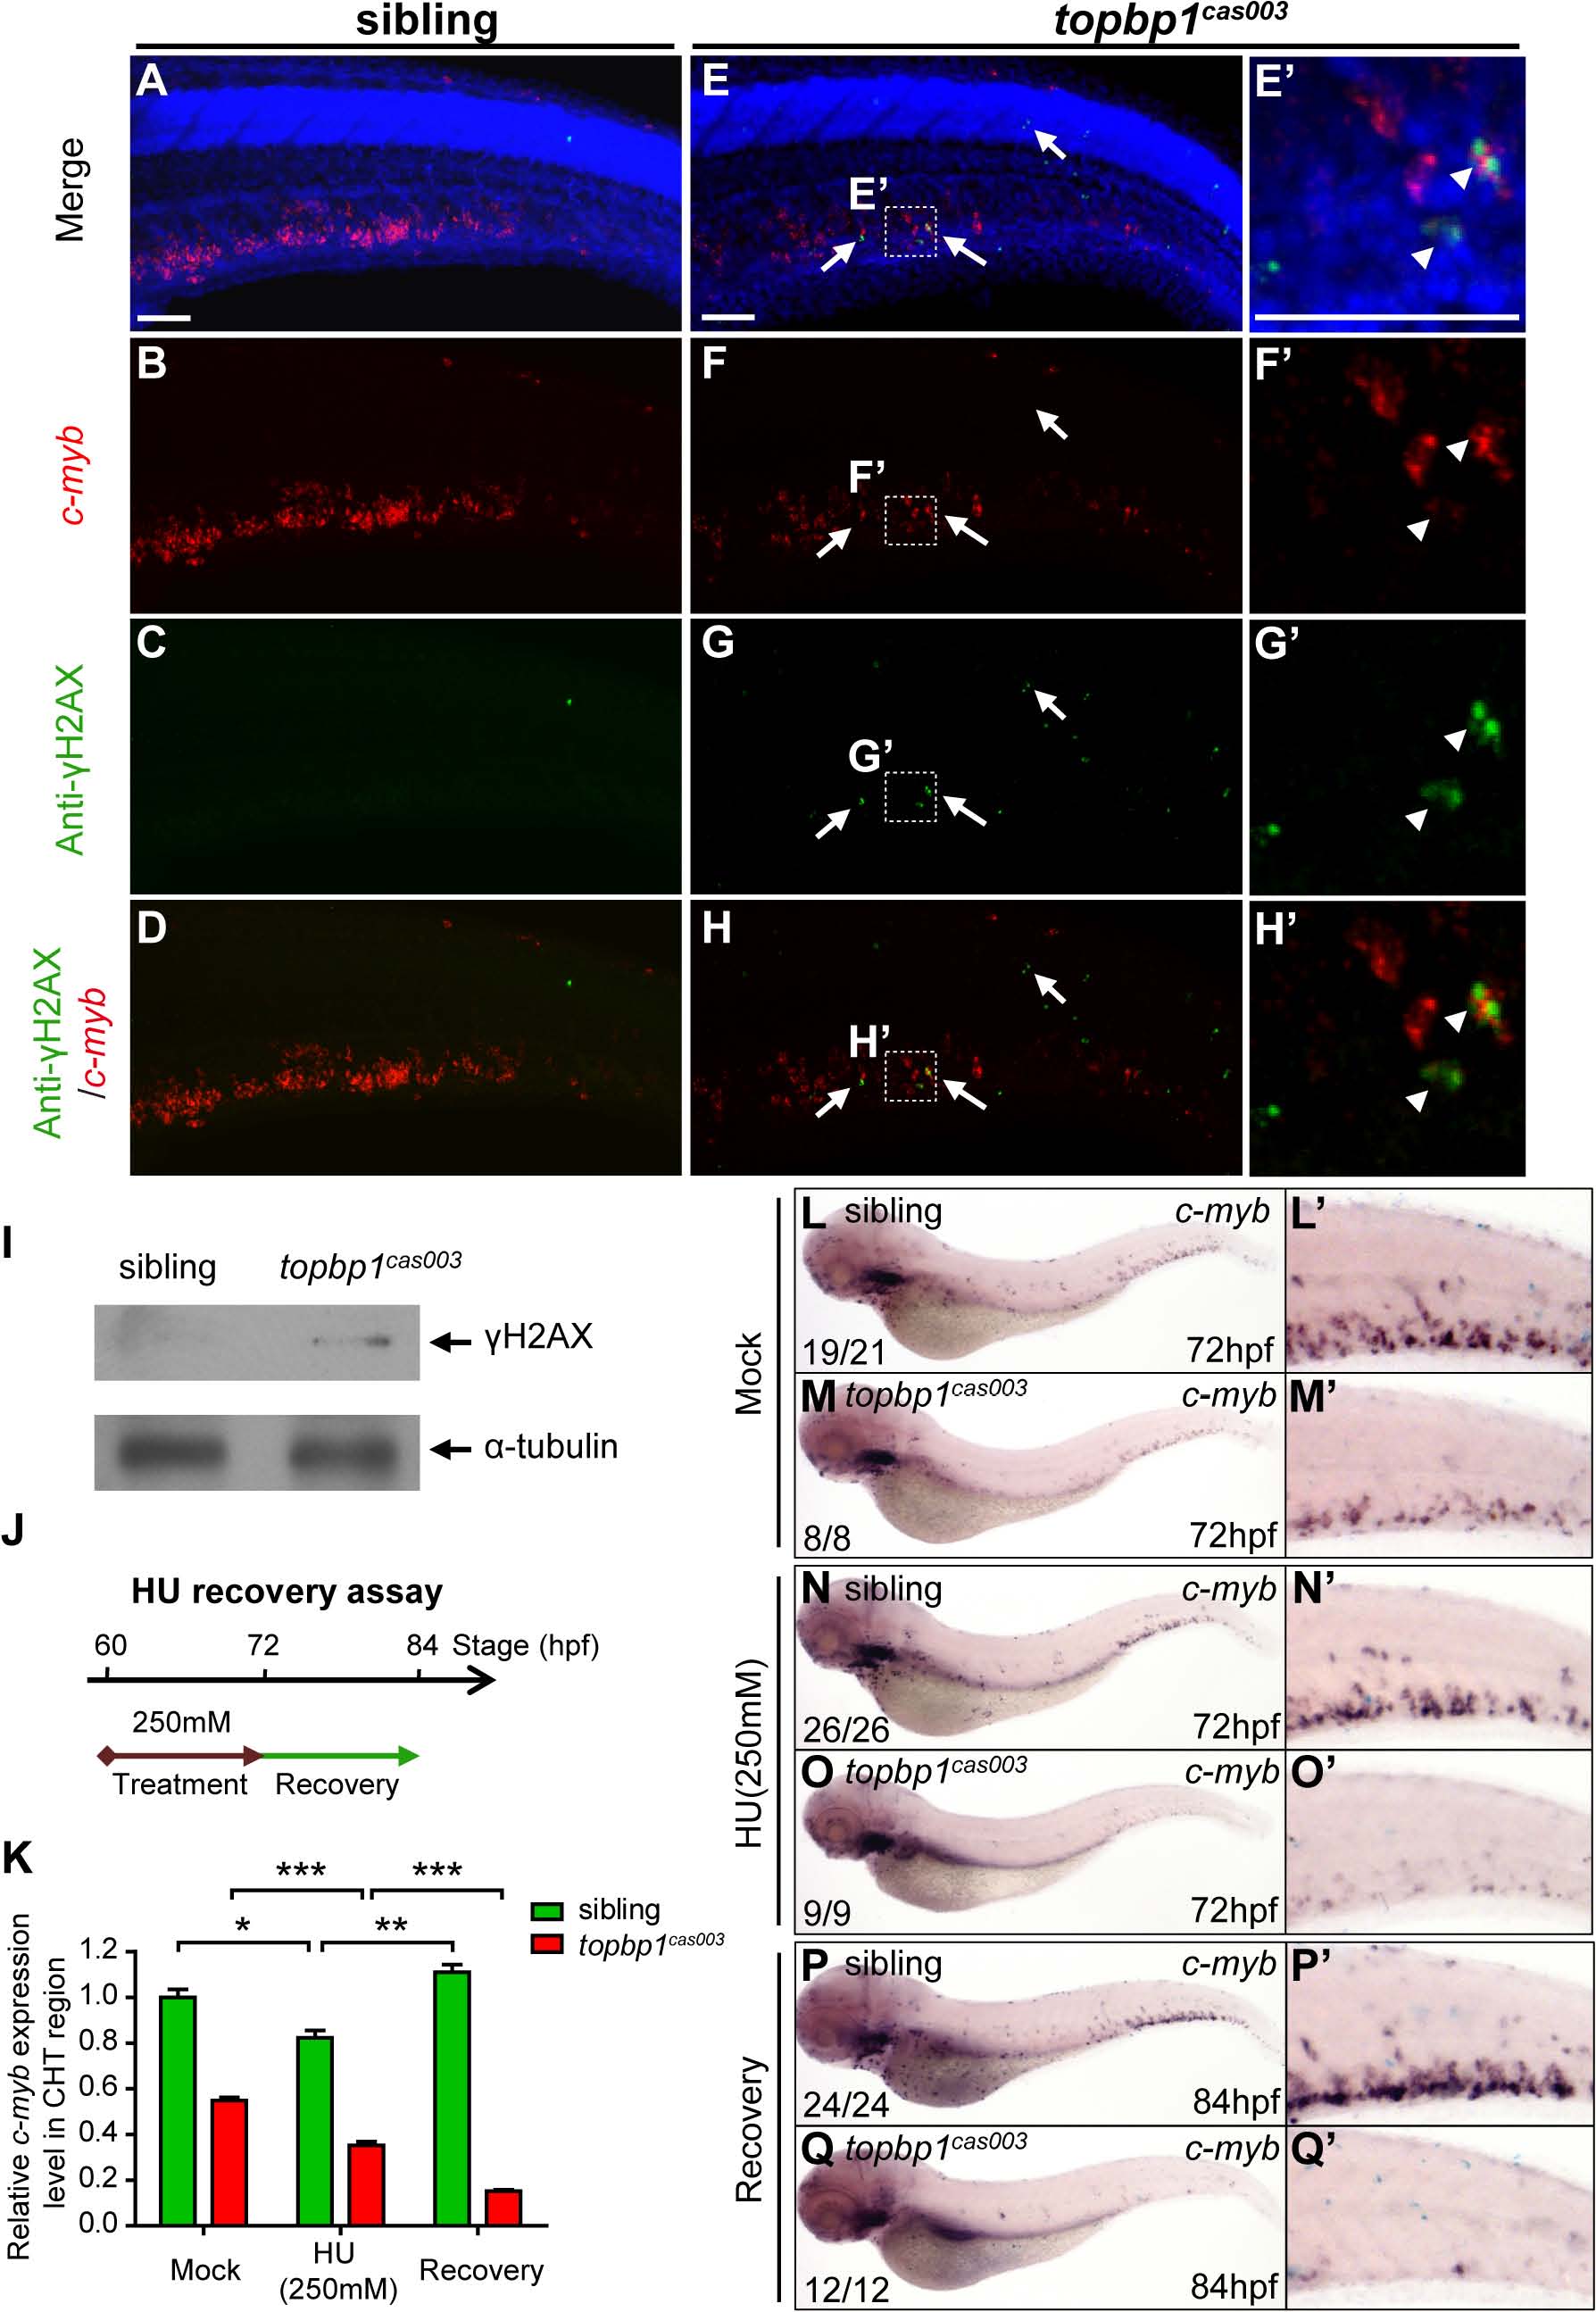
Fig. 7 topbp1cas003 mutants manifest deficient DNA damage repair capability.
(A-H′) Immuno-staining of γH2AX (green), c-myb fluorescent in situ hybridization (red) and DAPI stain (blue) in sibling and topbp1cas003 mutant embryos at 3.5dpf. (E′-H′) Magnified views of the regions in the dashed boxes showing γH2AX+; c-myb+; DAPI+ cell in the CHT region. Arrows indicate the γH2AX+; DAPI+ cells. The γH2AX+; DAPI+ cells are increased in topbp1cas003 mutants comparing to siblings. Moreover, γH2AX+; c-myb+; DAPI+ cells can only be detected in topbp1cas003 mutants (H′). Scale bars represent 50µm. (I) Immunoblotting showing increased γH2AX level in the CHT of topbp1cas003 mutant embryos at 3dpf. (J) Procedure of the hydroxyurea (HU) recovery assay. Brown arrow line represents 250mM HU or mock treatment from 60hpf to 72hpf; green arrow line indicates removal of HU or mock treatment from 72hpf to 84hpf for recovery. (K-Q) The c-myb expression is further decreased in topbp1cas003 mutant embryos under HU treatment. Wild-type siblings or topbp1cas003 mutant embryos, after 12-hours mock treatment or after 12-hours 250mM HU treatment and sequential 12-hours recovery, were analyzed by either quantitative PCR (K) or c-myb WISH analysis (L-Q). c-myb level can be recovered in wild-type siblings, but not in topbp1cas003 mutant embryos. The penetrance of the indicated phenotype is shown in the bottom left of each panel. Error bars represent SEM. * p<0.05; ** p<0.01; *** p<0.001. (L′-Q′) Enlarged views of the CHT region of embryos in the left columns.