
|
Fig. S1
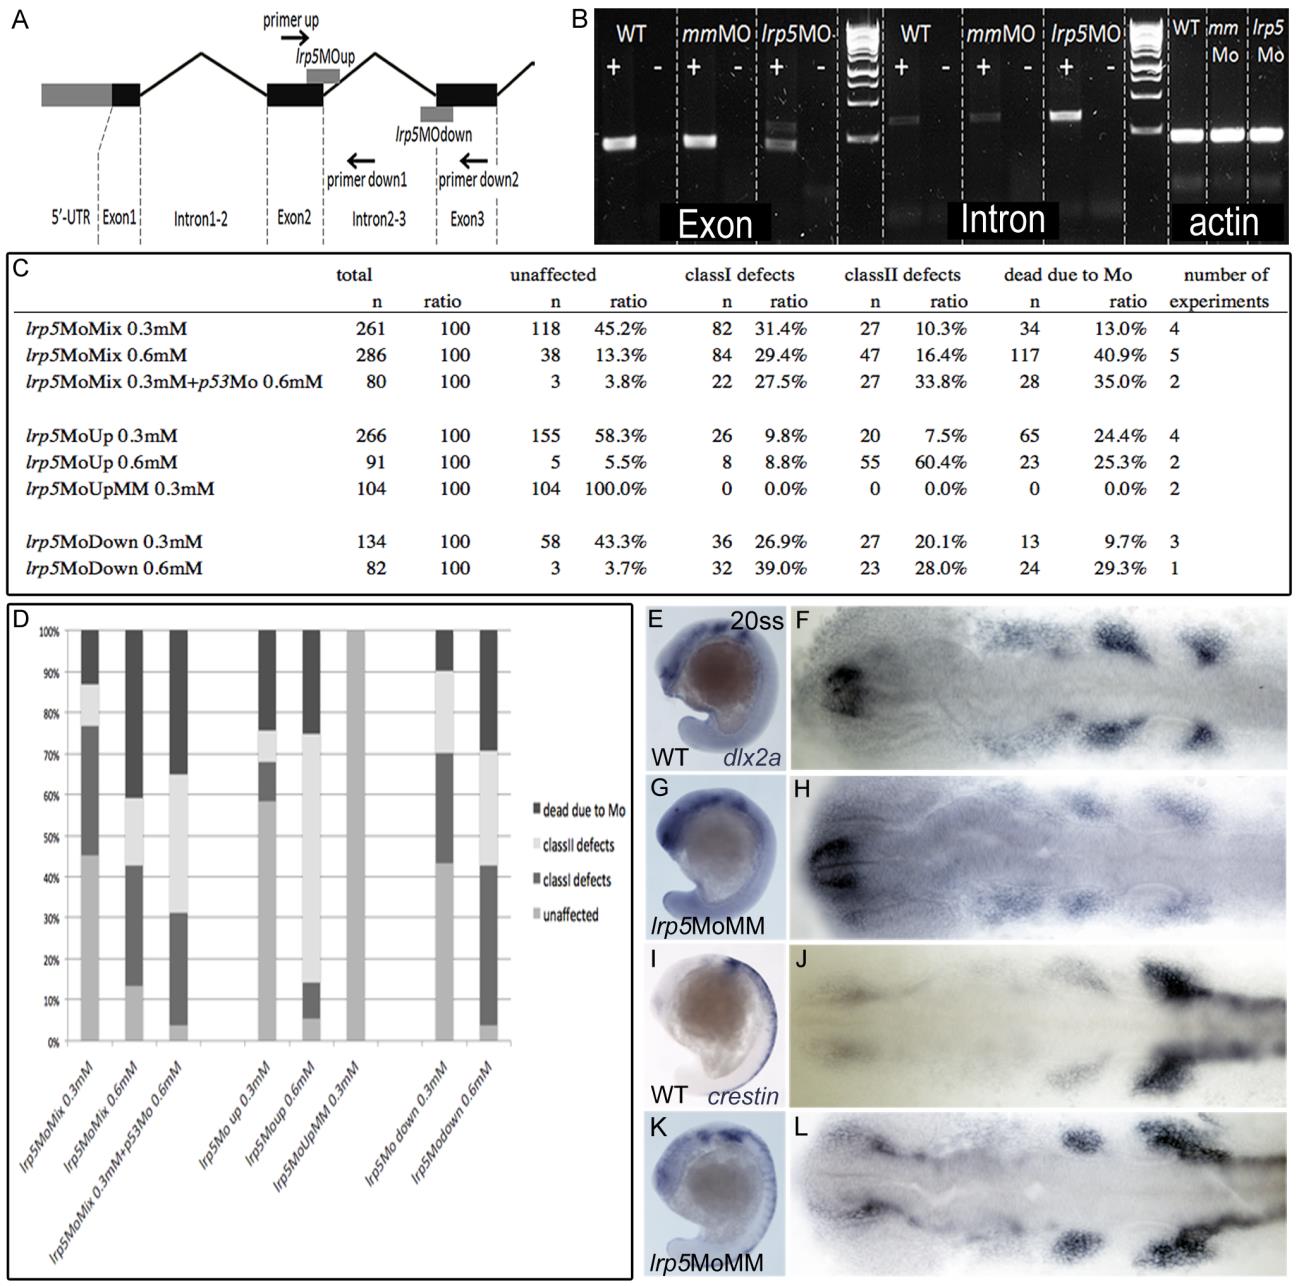
(A)Schematic representation of lrp5 transcript and Mo knock-down strategy. (B) Semi-quantitative RT-PCR in morphant embryos, +/- indicates presence or absence of reverse transcriptase. (C) Table presenting distribution of phenotypes upon injection with lrp5 MOs. (D) Graphical presentation of data shown in (C). (E-L) 20 ss embryos stained for different transcripts. (E,F) Wild-type embryo stained for dlx2a. (G,H) lrp5 mismatch morphant stained for dlx2a. (I,J) Wild-type embryo stained for crestin. (K,L) lrp5 mismatch morphant embryo stained for crestin. Note that mismatch Mo injection does not result in alterations of dlx2a/crestin expression patterns. Anterior is to the left in E-L.