
|
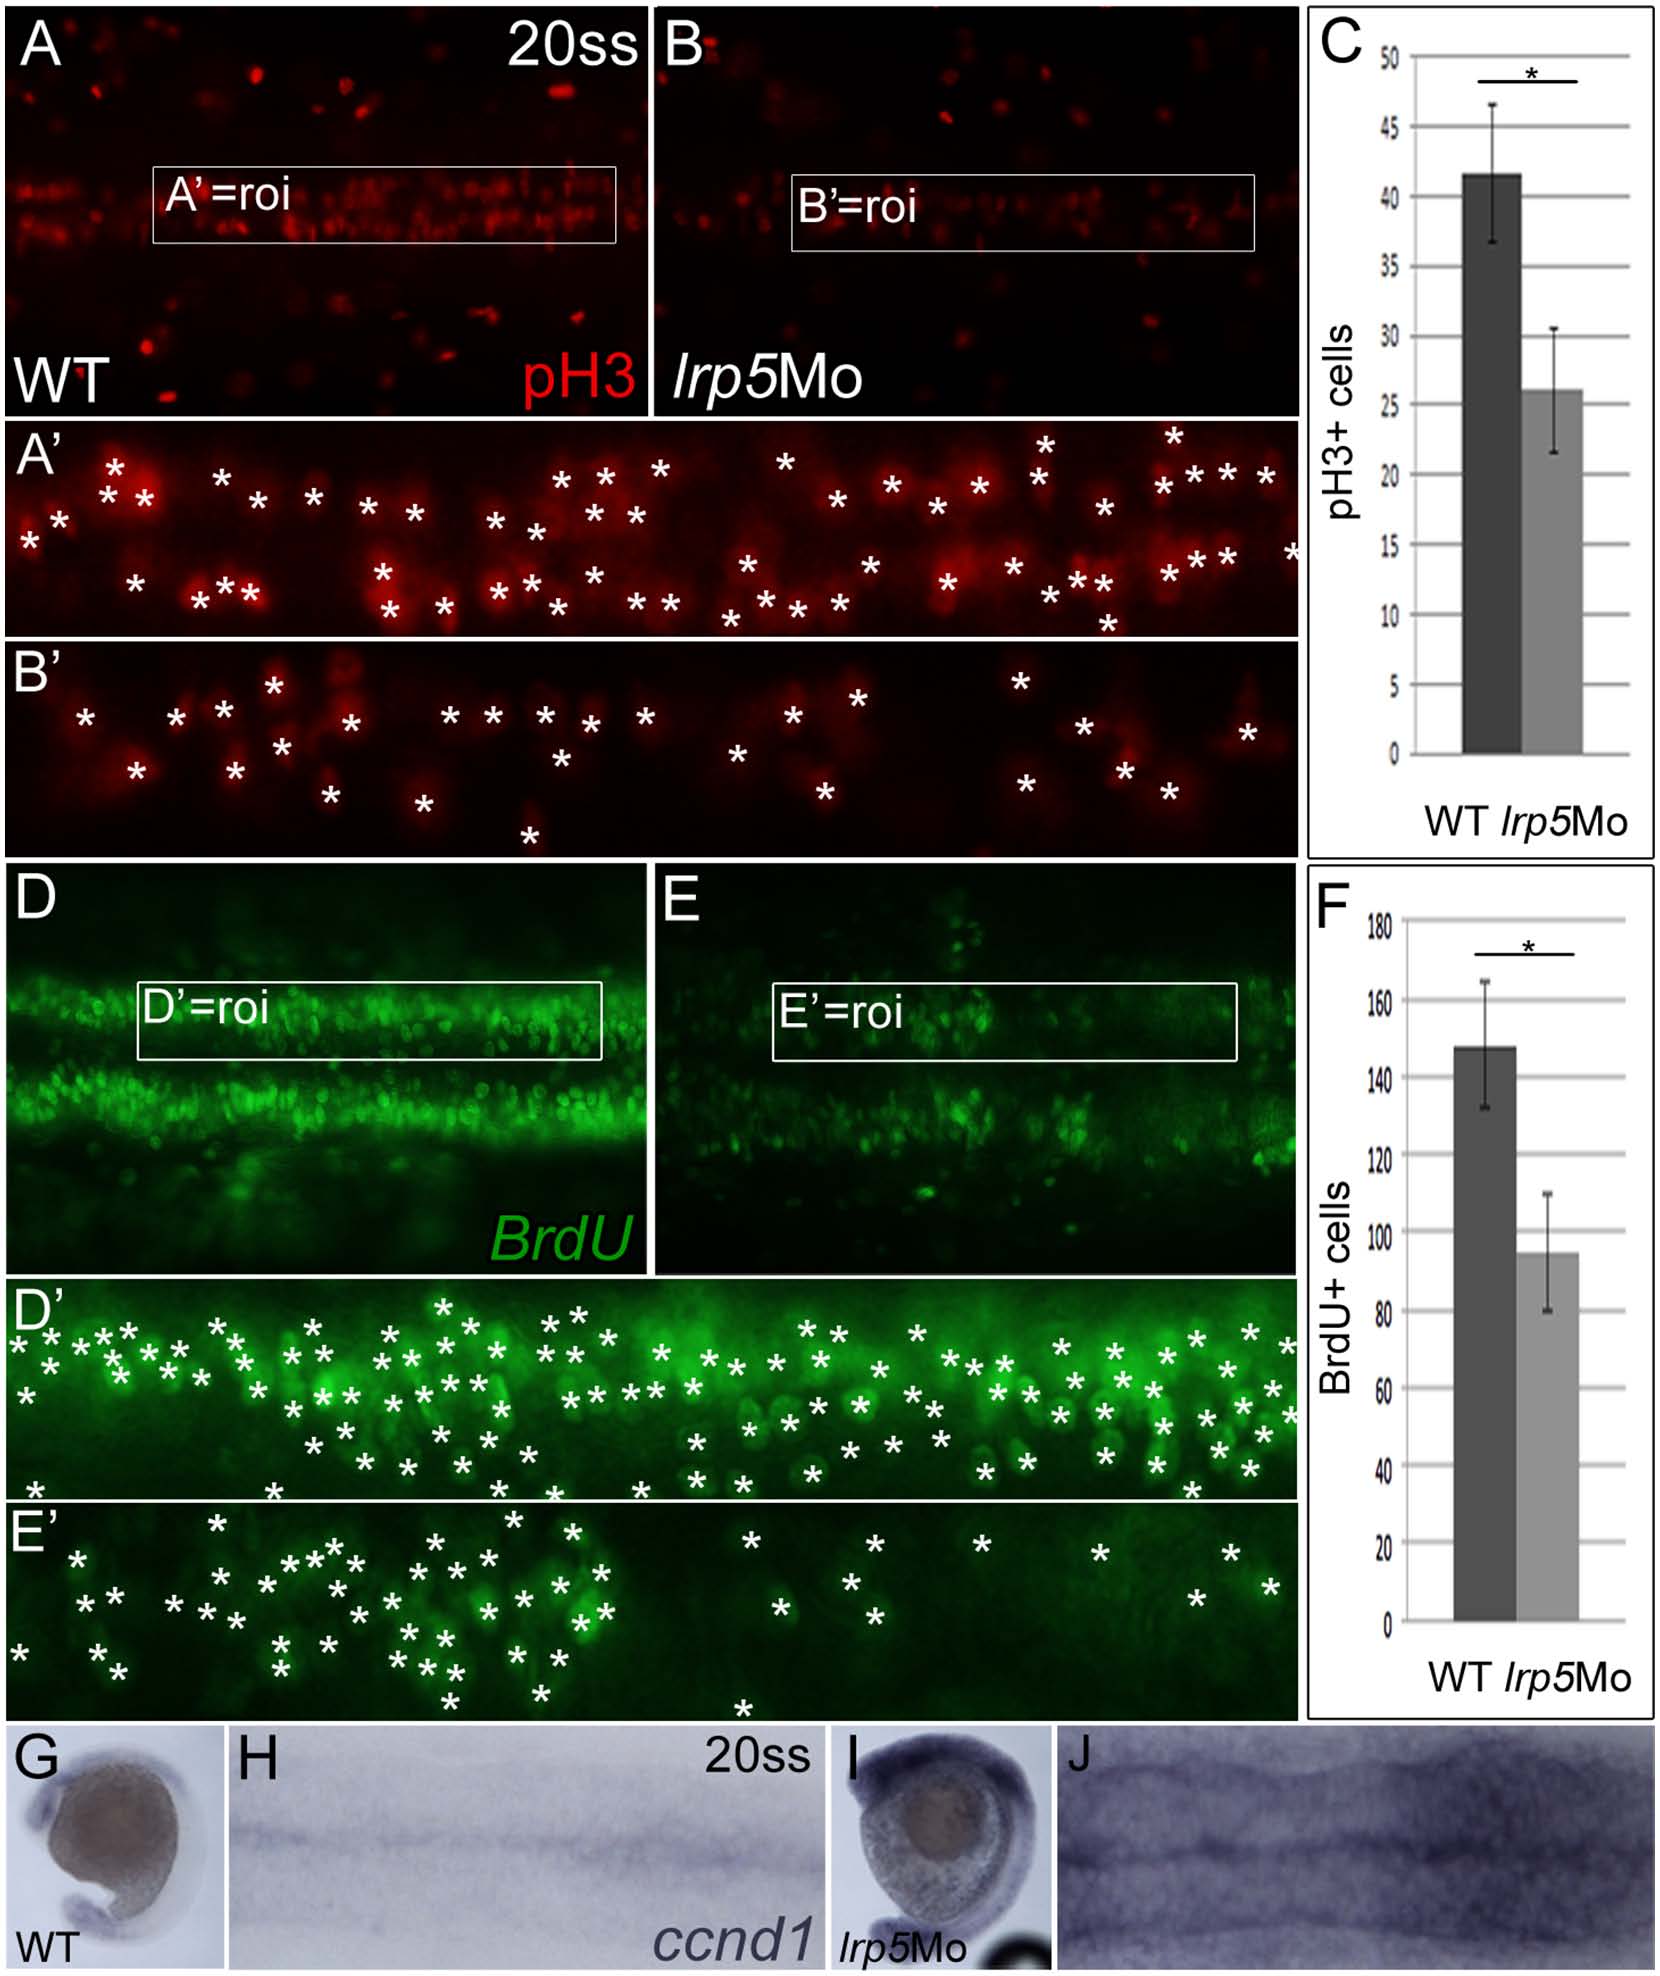
Fig. 6 Proliferation of premigratory CNCCs is affected by knock-down of lrp5.
(A,B) 20 ss embryos stained for pH3 cells in M-phase. (A) Wild-type embryo, (B) lrp5 morphant. Frames demarcate area of cell count (roi, region of interest) and are magnified in (A′,B′) (counted nuclei marked by asterisks). Note that in lrp5 morphants pH3 positive cells are reduced in number. (C) Quantification of pH3 cell numbers in the neuroepithelium of rhombomeres 4–8. N = 9/11 (wild-type/lrp5 morphant). *P < 106, t-test. (D,E) 20 ss embryos stained for BrdU incorporation. (D) Wild-type embryo, (E) lrp5 morphant. Frames demarcate area of cell count (roi) and are shown with higher magnification in (D′,E′). Note that in lrp5 morphants, BrdU labeled cells are reduced in number. (F) Quantification of BrdU cell numbers in one unilateral neuroepithelium of rhombomeres 4–8. N = 9/11 (wild-type/lrp5 morphant). *P = 1.05x10⁻⁶, t-test. (G-J) ccnd1 expression in 20 ss embryos. (G,H) Wild-type embryo, (I,J) lrp5 morphant. Note that ccnd1 expression levels are increased in lrp5 morphants. Anterior is to the left in all images.