
|
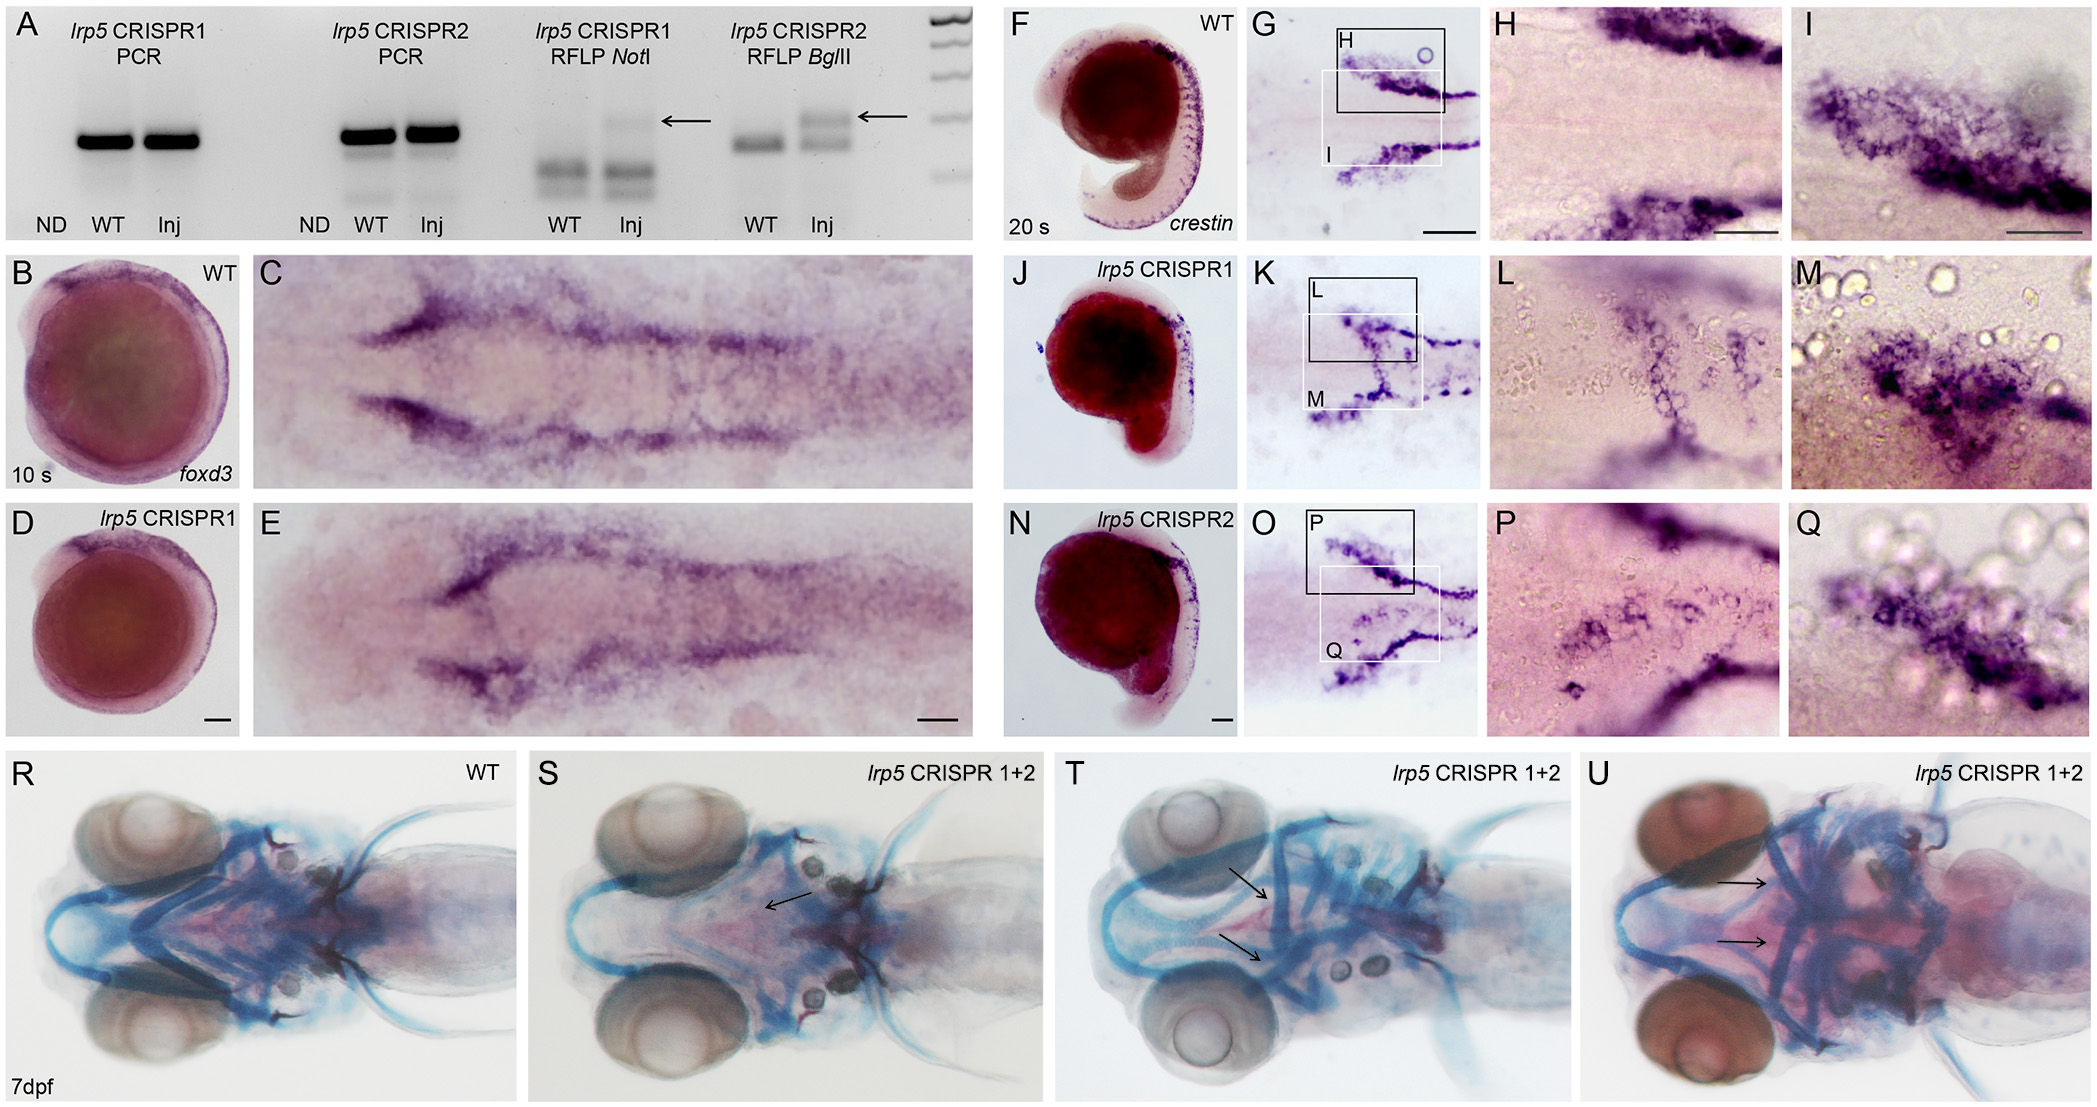
Fig. 5 lrp5 CRISPR/Cas9 injected embryos display normal CNCC induction, but defective CNCC cell migration.
(A) RFLP analysis of 15 pooled embryos per sample. Both, lrp5 CRISPR1 and CRISPR2 generate mutations indicated by presence of undigested mutant bands after NotI and BglII digestion (right lanes), respectively. Left lanes show non-digested (ND) PCR products. (B-E) In situ hybridization showing foxd3 expression at 10 ss in wild-type embryos (B, C) and lrp5 CRISPR1 injected embryos (D,E). (F-Q) crestin expression at 20 ss in wild-type embryos (F-I), lrp5 CRISPR1 injected embryos (J-M), and lrp5 CRISPR2 injected embryos (N-Q). (R-U) Combined bone and cartilage staining at 7 dpf in wild-type (R) and lrp5 CRISPR1 and CRISPR2 co-injected embryos showing cartilage defects with different degrees of severity. Note absence of ceratobranchials 1–4 (in S; arrow), and flipped ceratohyal (in T,U; arrows). (B,D,F,J,N) Lateral views with anterior to the left. All remaining images are dorsal views, except (R-U), which are ventral views. Higher magnification views of areas boxed in (G,K,O) are shown in accompanying images (I, M and Q, white boxes) and (H, L and P, black boxes). Note ectopic crestin positive cells in dorsal neuroepithelium (K,L,O,P) and reduced migratory CNCCs streams (K,M,O,Q) in lrp5 CRISPR injected embryos. Scale bars: 100 µm (D,G,N) and 50µm (E,H,I).