
Fig. 4
- ID
- ZDB-IMAGE-150915-21
- Genes
- Publication
- Willems et al., 2015 - The Wnt Co-Receptor Lrp5 Is Required for Cranial Neural Crest Cell Migration in Zebrafish
- All Figures
- Figures for Willems et al., 2015
|
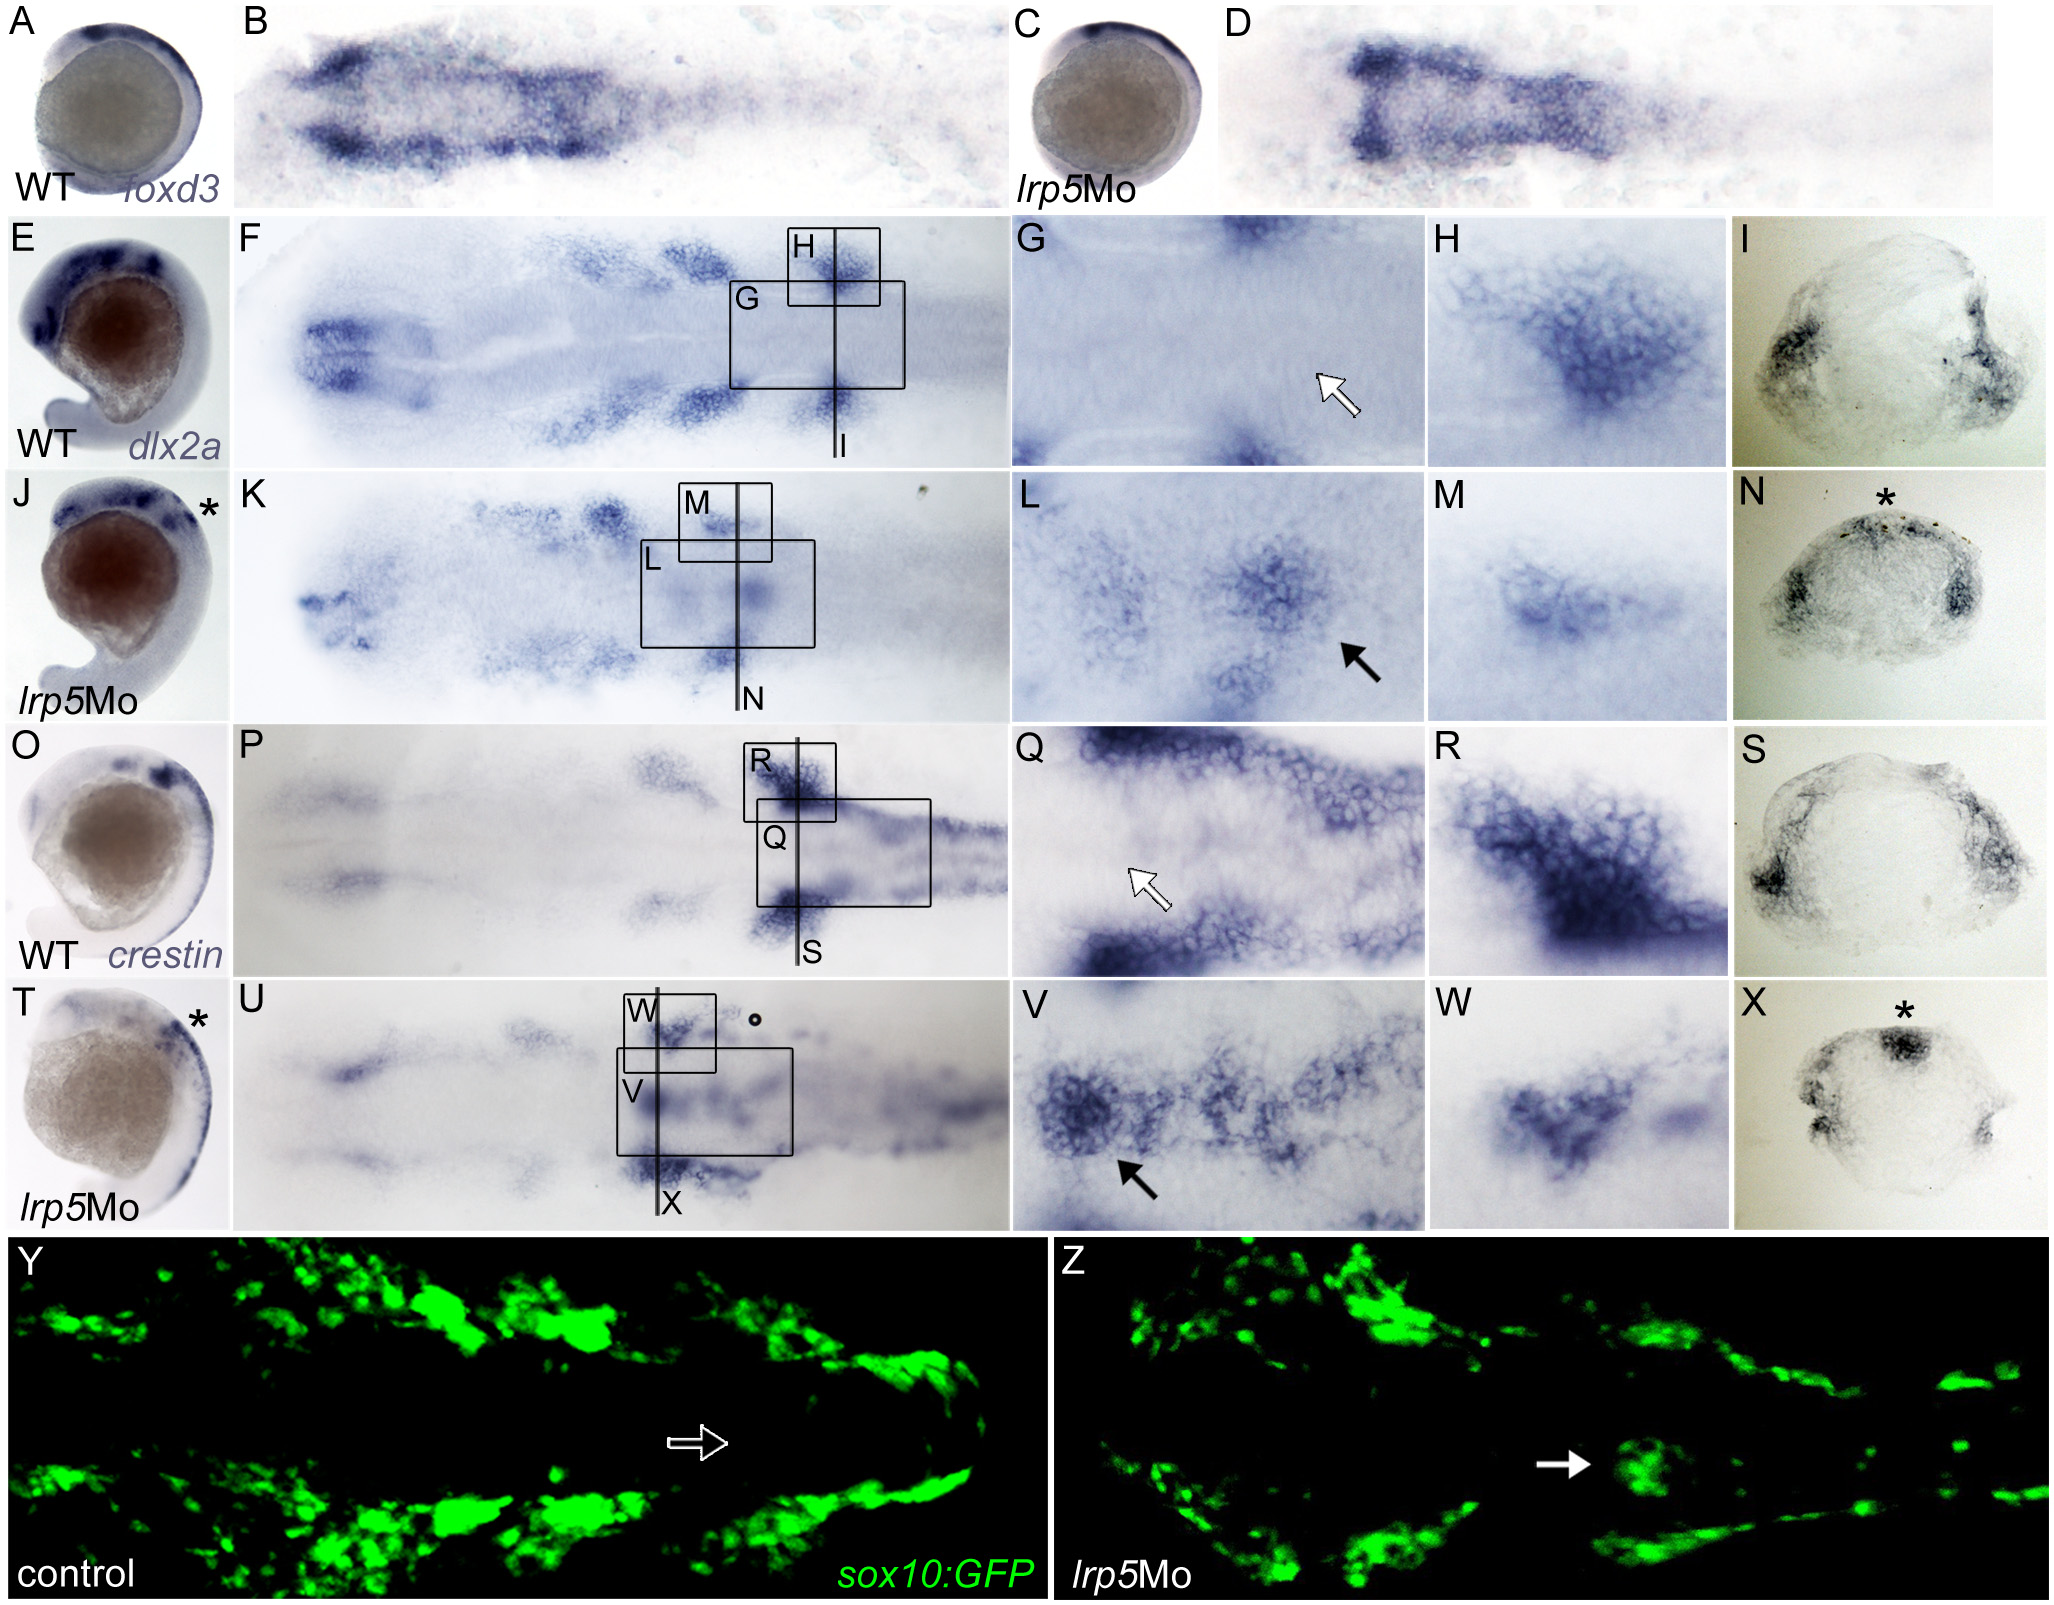
Fig. 4 lrp5 morphants display normal induction but defective migration of CNCCs.
(A-D) Embryos at 10 ss stained for foxd3 transcripts. (A,B) Wild-type embryo, (C,D) lrp5 morphant. Note normal pattern of foxd3 expression in morphants. (E-N) Embryos at 20 ss stained for dlx2a. (E-I) Wild-type embryo, (J-N) lrp5 morphant. Note ectopic dlx2a expression at dorsal neuroepithelium of rhombomere 6 in lrp5 morphants (asterisk in J,N; arrow in L) and that streams of branchial migratory CNCCs are reduced (M). (O-X) crestin expression in embryos at 20 ss. (O-S) Wild-type embryo, (T-X) lrp5 morphant. Note ectopic crestin expression at dorsal neuroepithelium of rhombomere 6 in lrp5 morphants (asterisk in T,X; arrow in V) and that streams of branchial migratory CNCCs are reduced (M). (Y,Z) Confocal projections of sox10:GFP embryos at 20 ss showing GFP expression in CNCCs. (Y) Uninjected control embryo, (Z) lrp5 morphant. Note ectopic GFP cells at dorsal neuroepithelium of rhombomere 6 in lrp5 morphants (arrow) and that streams of branchial migratory CNCCs are reduced. Anterior is to the left in all images, except cross sections. Boxed areas indicate regions shown in higher magnification in accompanying images. Positions of cross sections in I,N,S,X are indicated by lines in F,K,P,U.