
|
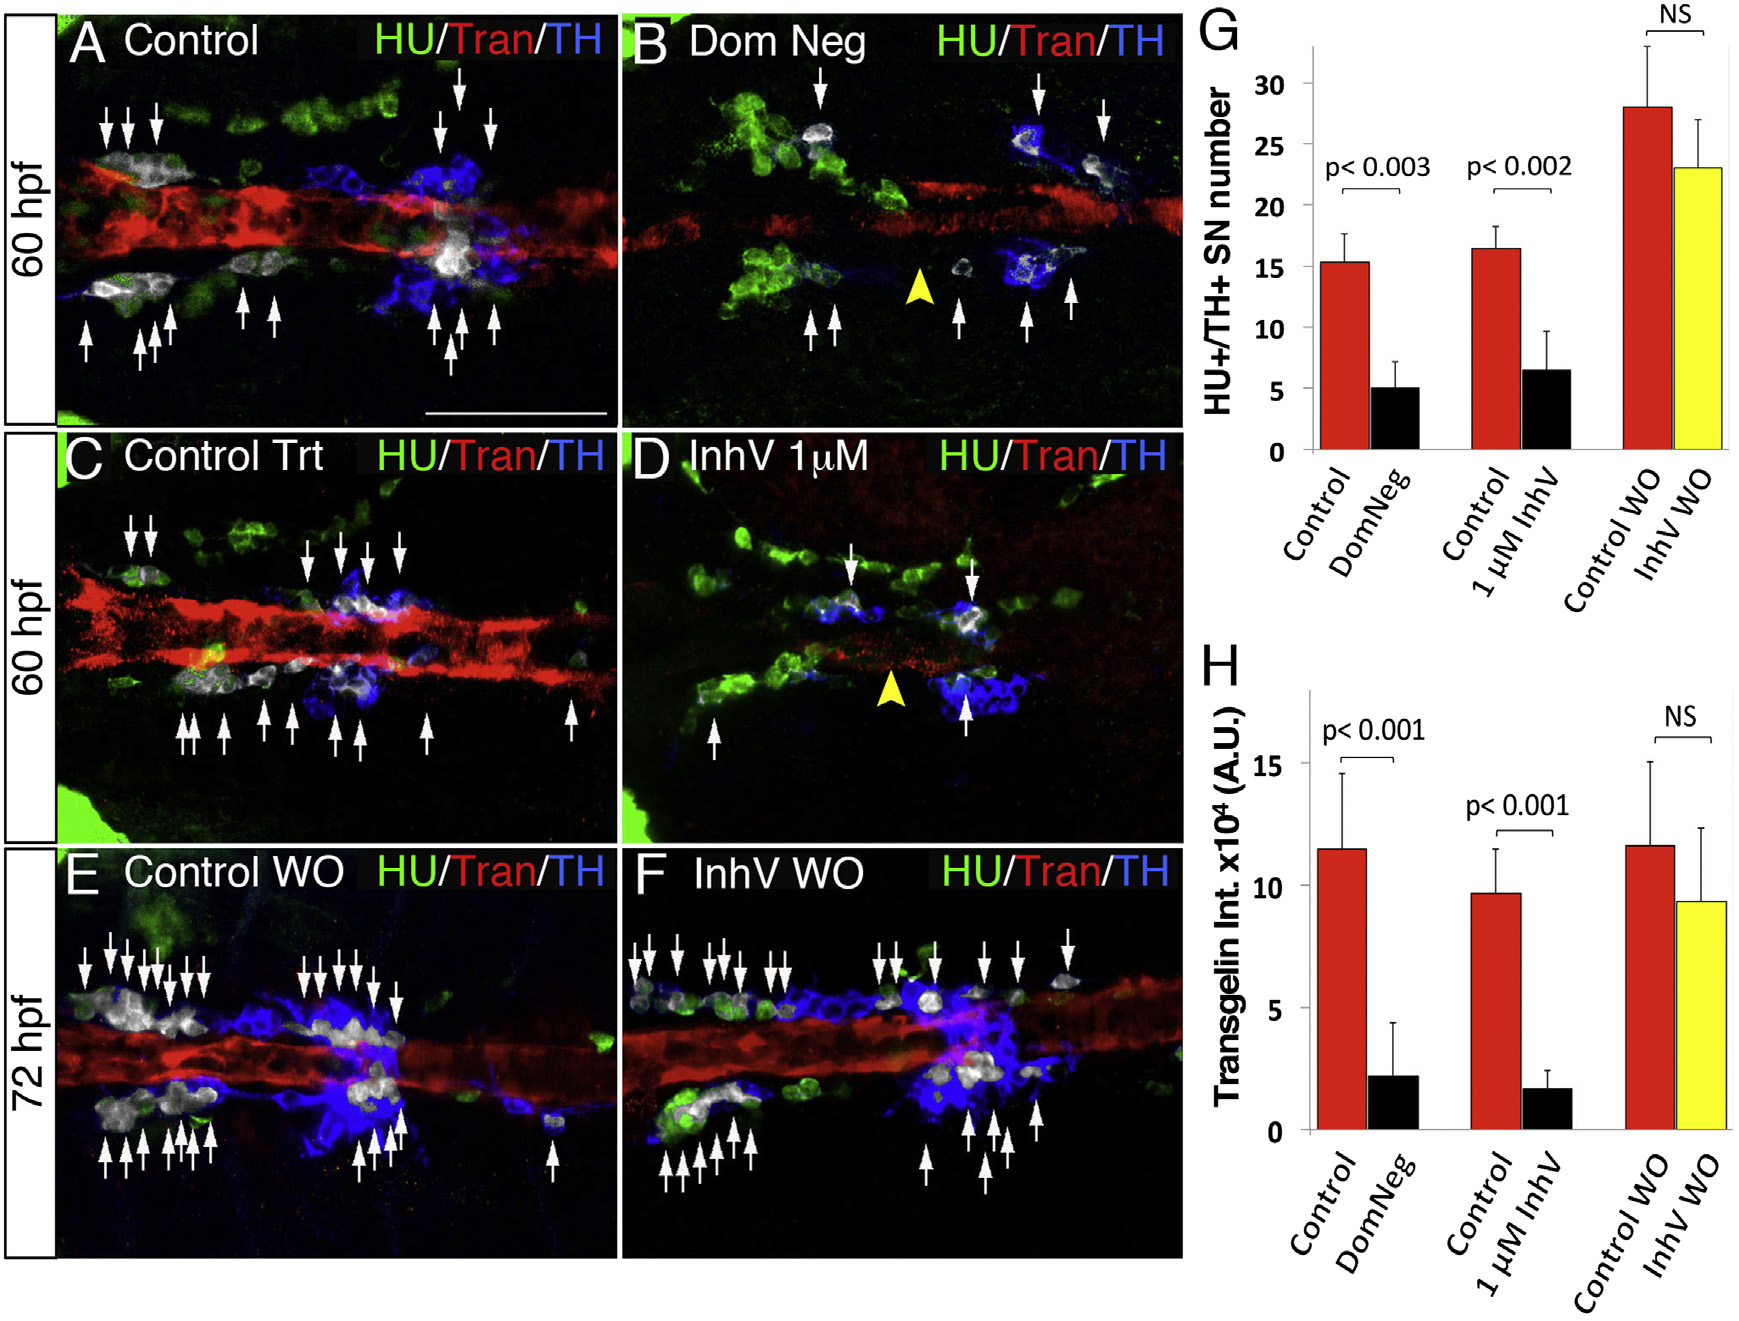
Fig. 6
PDGF Inhibition Affects VMC Coverage and NA Differentiation
(A–F) Confocal analysis of Tg(kdrl:EGFP)la116 zebrafish embryos at the times indicated in the lateral panel and immunostained for HU (green), Transgelin (red), and TH (blue). Dorsal views (anterior is to the left). Arrows indicate white pseudocolored HU+/TH+ SNs. (A and B) Heat-shock embryos negative for dnPDGFRβ -YFP expression (A) and those heat-shock-induced embryos transiently expressing dnPDGFR²-YFP (B) at 60 hpf. Arrowhead indicates the reduced VMC coverage in positive dnPDGFRβ-YFP embryos. (C and D) Control embryos treated with DMSO (C) or 1 µM of PDGFR inhibitor InhV (D) between 48 and 60 hpf. Arrowhead indicates the reduced VMC coverage in PDGFR inhibitor-treated embryos. Note presence of HU+ cells but few HU+/TH+ SNs (D). (E and F) After 1 µM InhV exposure between 48 and 60 hpf, the drug was withdrawn and embryos were maintained in control conditions for an additional 12 hr (60–72 hpf). NA differentiation recovered following InhV withdrawal.
(G) Quantitative analysis of HU+/TH+ SNs.
(H) Quantitative analysis of Transgelin fluorescence intensity. Data were calculated from three independent experiments.
NS, not significant; error bars indicate SD. A.U., arbitrary units; hpf, hours post-fertilization. Scale bar, 75 µm (A–F). See also Figure S5.