
|
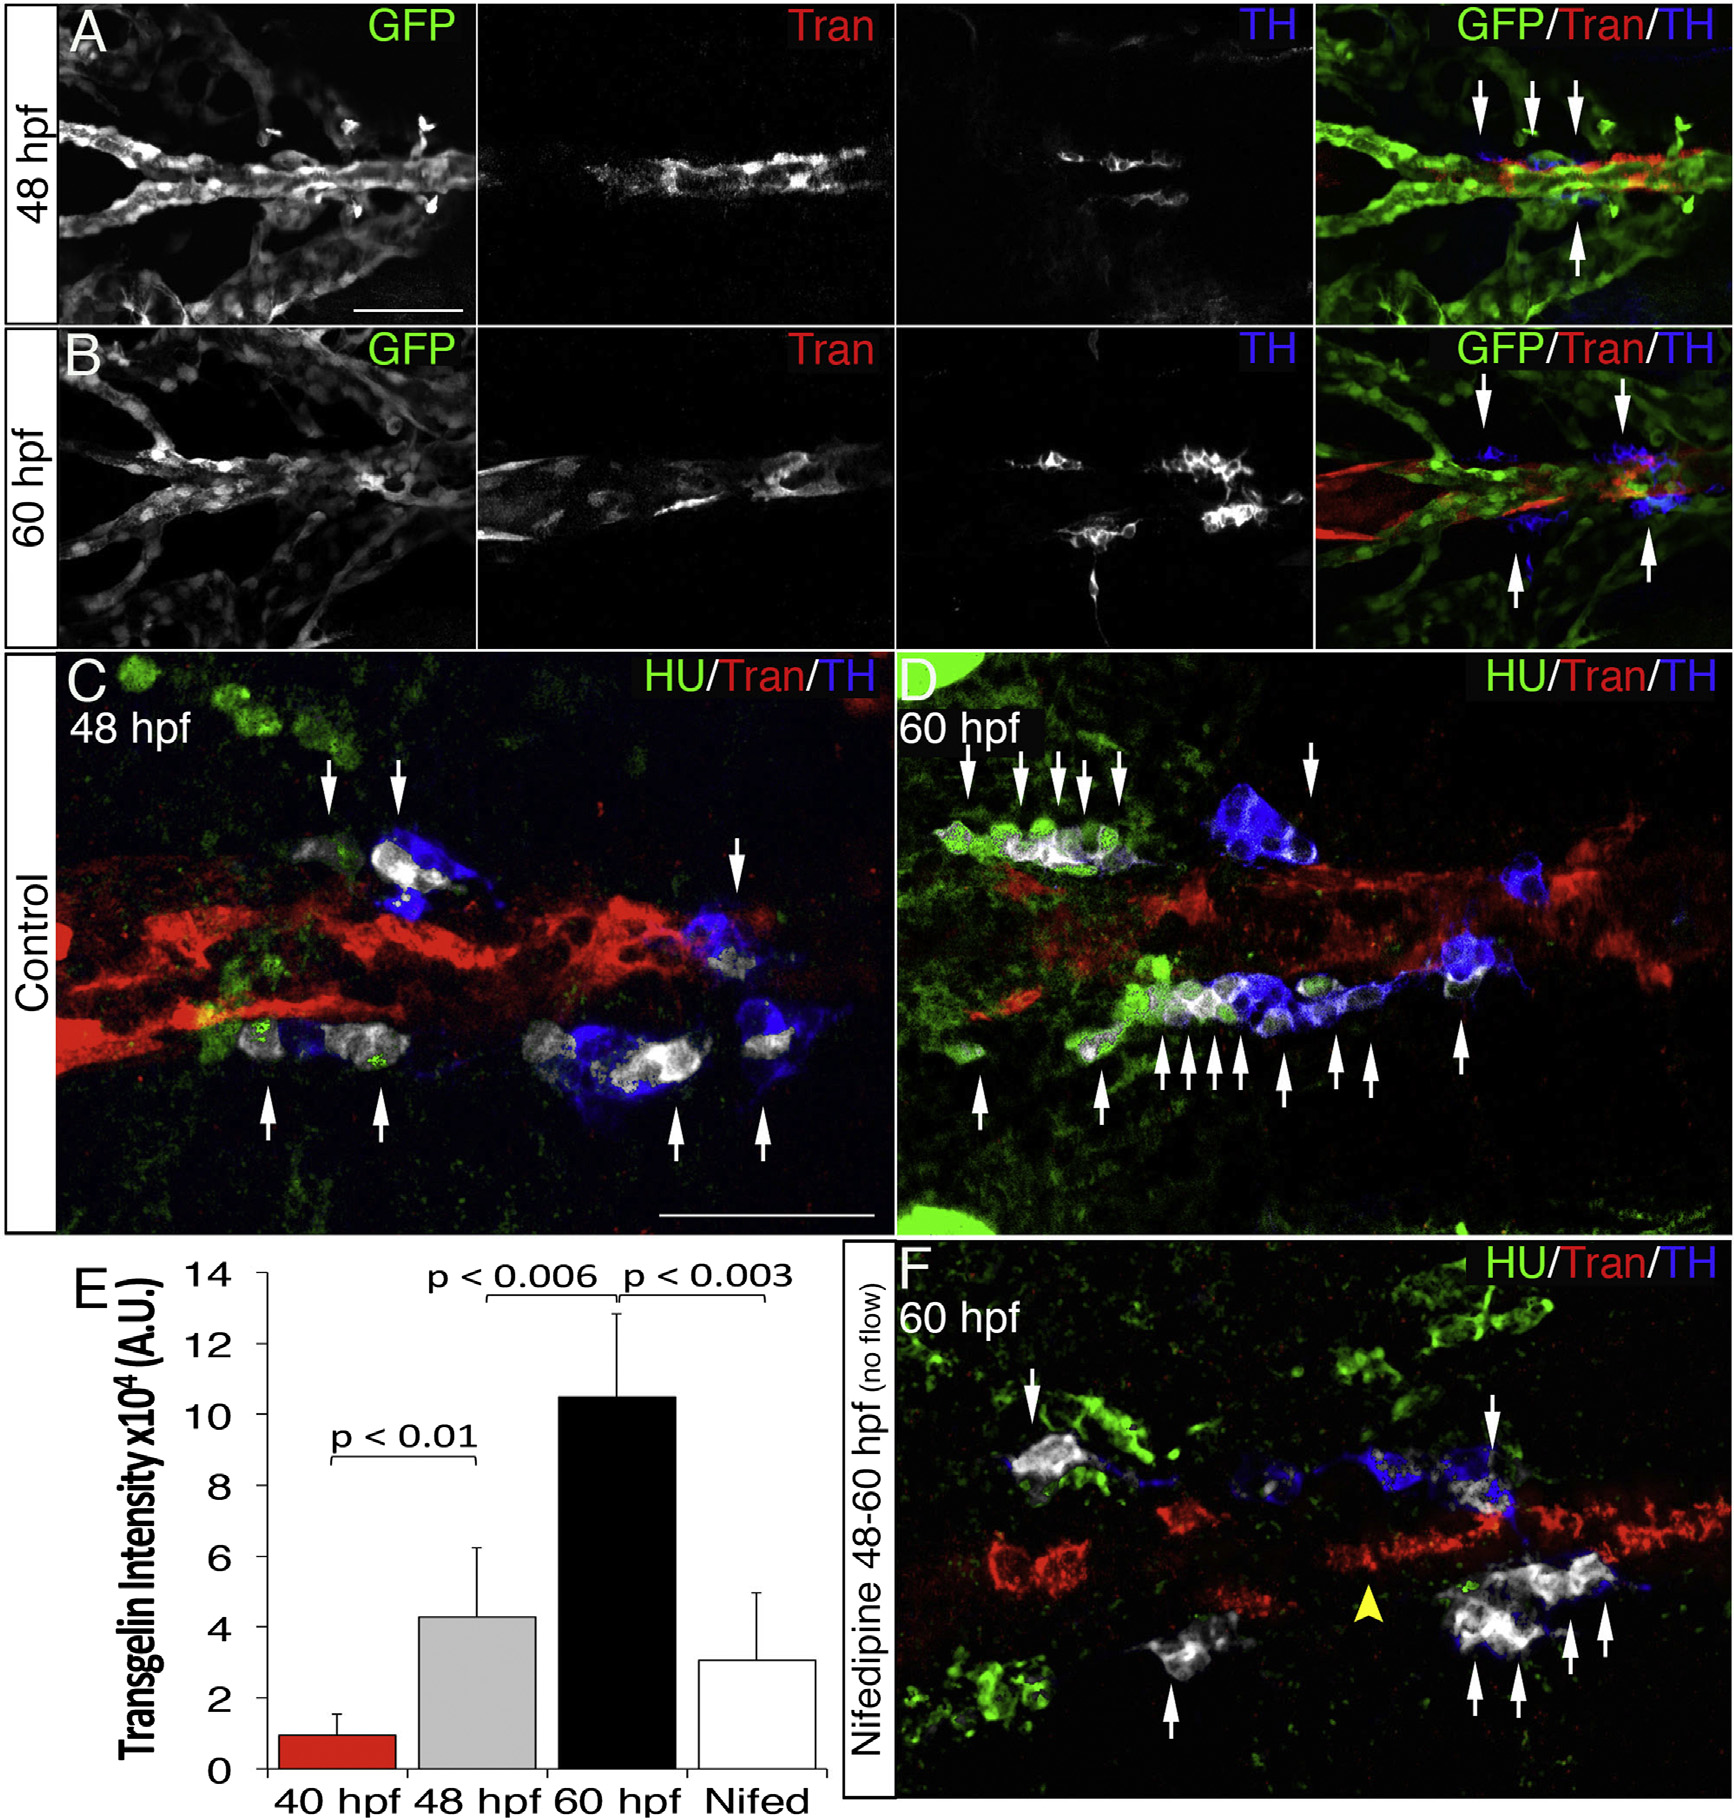
Fig. 5
Blood Flow Triggers VMC Coverage and NA Differentiation
(A and B) Dorsal views (anterior is to the left) of whole-mount Tg(kdrl:EGFP)la116 zebrafish embryos immunostained with antibodies to detect GFP (endothelial cells, green), Transgelin (vascular mural cells, red), and TH (blue) at 48 (A) and 60 hpf (B). (A and B) Note appearance of Transgelin+ VMCs next to TH+ cells (arrows).
(C and D) HU+/TH+ SNs (pseudocolored white) are next to VMCs (Transgelin+, red) at 48 (C) and 60 hpf (D).
(E) Quantification of total Transgelin fluorescence intensity in control or 40 µM nifedipine-treated embryos. A.U., arbitrary units. Data were calculated from three independent experiments. Error bars indicate SD.
(F) Confocal images of Tg(kdrl:EGFP)la116 zebrafish embryos treated with 40 µM nifedipine for 12 hr starting at 48 hpf and immunostained for HU (green), Transgelin (red), and TH (blue). Note reduced VMC coverage and lower numbers of HU+/TH+ SNs.
Scale bars, 75 µm (A–F). See also Figure S4.