
|
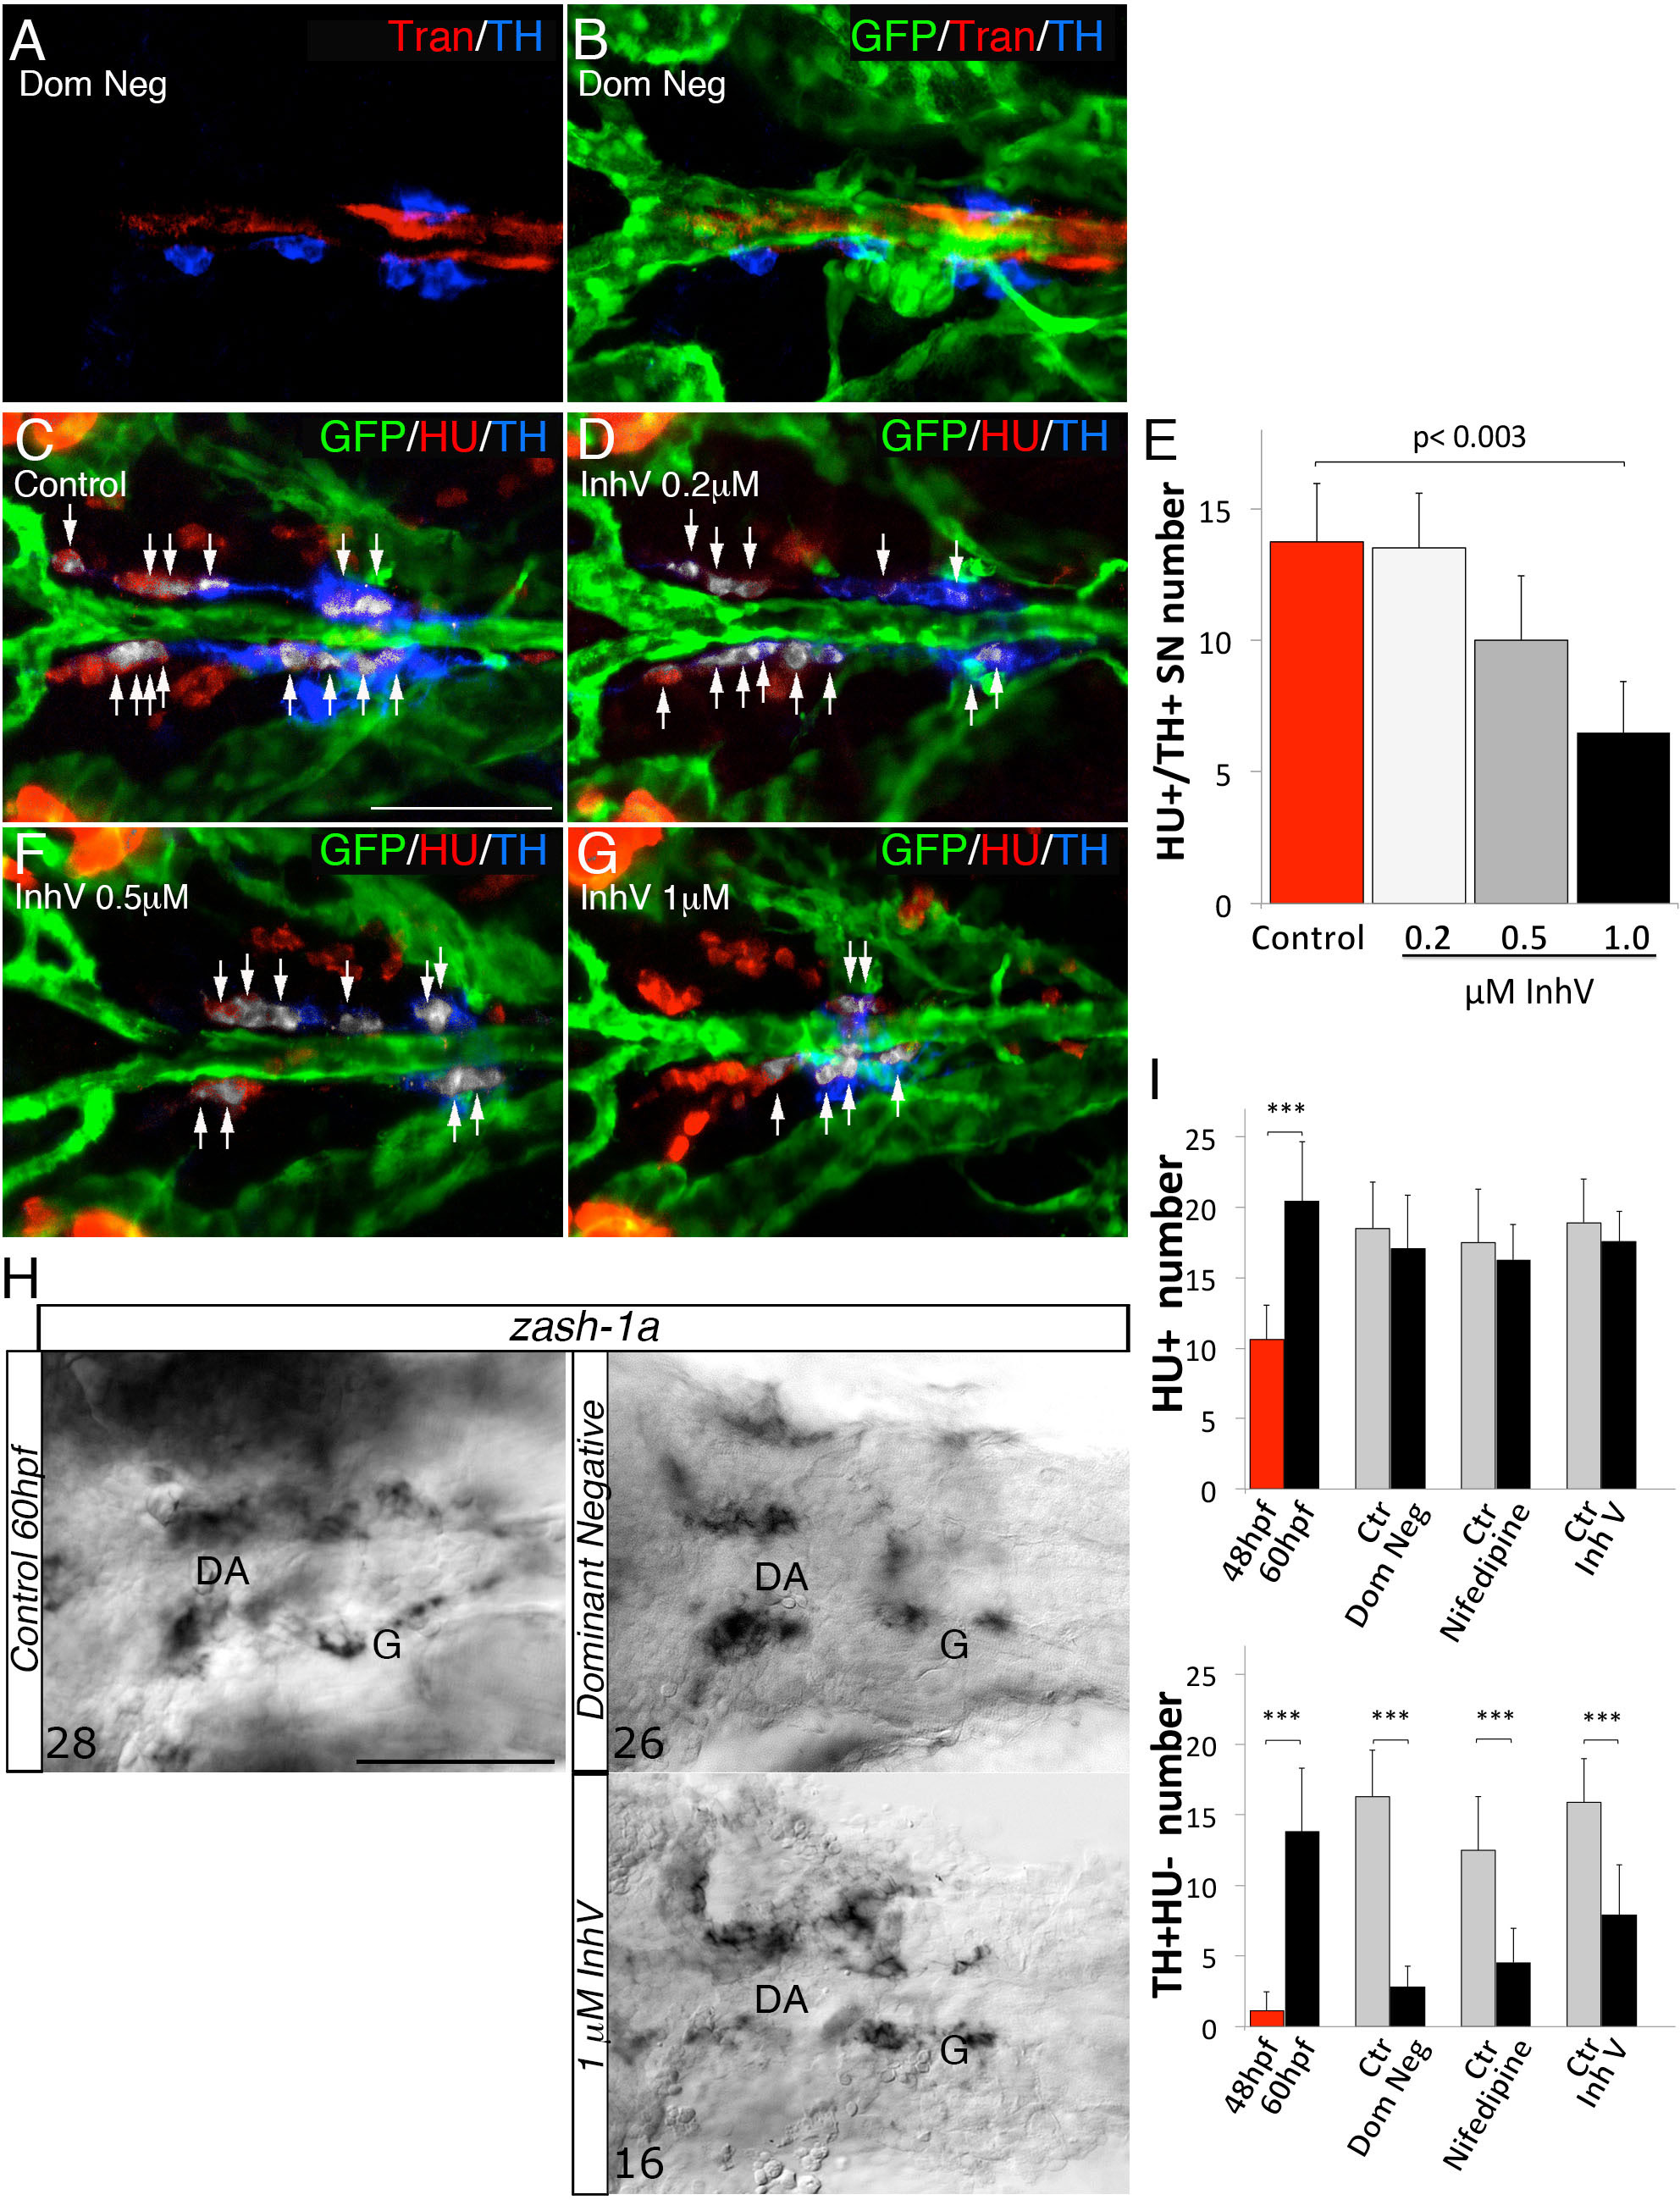
Fig. S5 Interference with VMC recruitment does not affect HU+ cells and zash- 1a expression, related to Figure 6. (A-B) 60 hpf Tg(kdrl:EGFP)la116 zebrafish embryos injected with dnpdgfrβ-YFP and heat shocked at 24 hpf. Dorsal views (anterior is to the left). GFP, Trans and HU antibodies staining indicate that the treatment did not block vessel formation or blood flow but reduced number of Tran and TH positive cells compared to embryos heat shocked at 20 hpf and negative for dnPDGFRβ-YFP (see Fig. 6A). (C-D, F-G) Confocal analysis of control Tg(kdrl:EGFP)la116 zebrafish embryos (C) and embryos treated with increasing concentrations of PDGFR inhibitor InhV (D, F, G) and immunostained for GFP (green), HU (red) and TH (blue). Treatment with 1 µM InhV between 48 and 60hpf did not block vessel morphology and formation. Note presence of HU+ cells but absence of HU+/TH+ SNs (pseudocolored white) in embryos treated with 1 µM inhibitor (G). (E) Quantification of HU+/TH+ SNs in control- and PDGFR inhibitor-treated embryos. (H) Whole-mount in situ hybridizations with antisense riboprobe specific for zash-1a RNA expression at the indicated treatment conditions. Images are ventral views (anterior is to the left) of the region between LDA-DA connection (left) and the glomerular region (G) after dissection of the yolk sac. Zash-1a positive sympathetic ganglionic precursors around the DA were not blocked by treatments that interfered with VMC recruitment at 60hpf. Numbers of analyzed embryos are indicated. (I) Quantitative analysis of HU+ cells and Hu-/TH+ cells after different treatments that interfered with VMC recruitment. Note that HU+ cell number is not disturbed by transient expression of dnpdgfrβ-YFP or 1 µM InhV, while the number of Hu-/TH+ cells is reduced. Data were calculated from three independent experiments. N.S., not significant; error bars indicate SD. DA, dorsal aorta; G, glomerulus, hpf, hours postfertilization. Scale bar: 75 µm in A-D, F-H. See also Figure 6.