
|
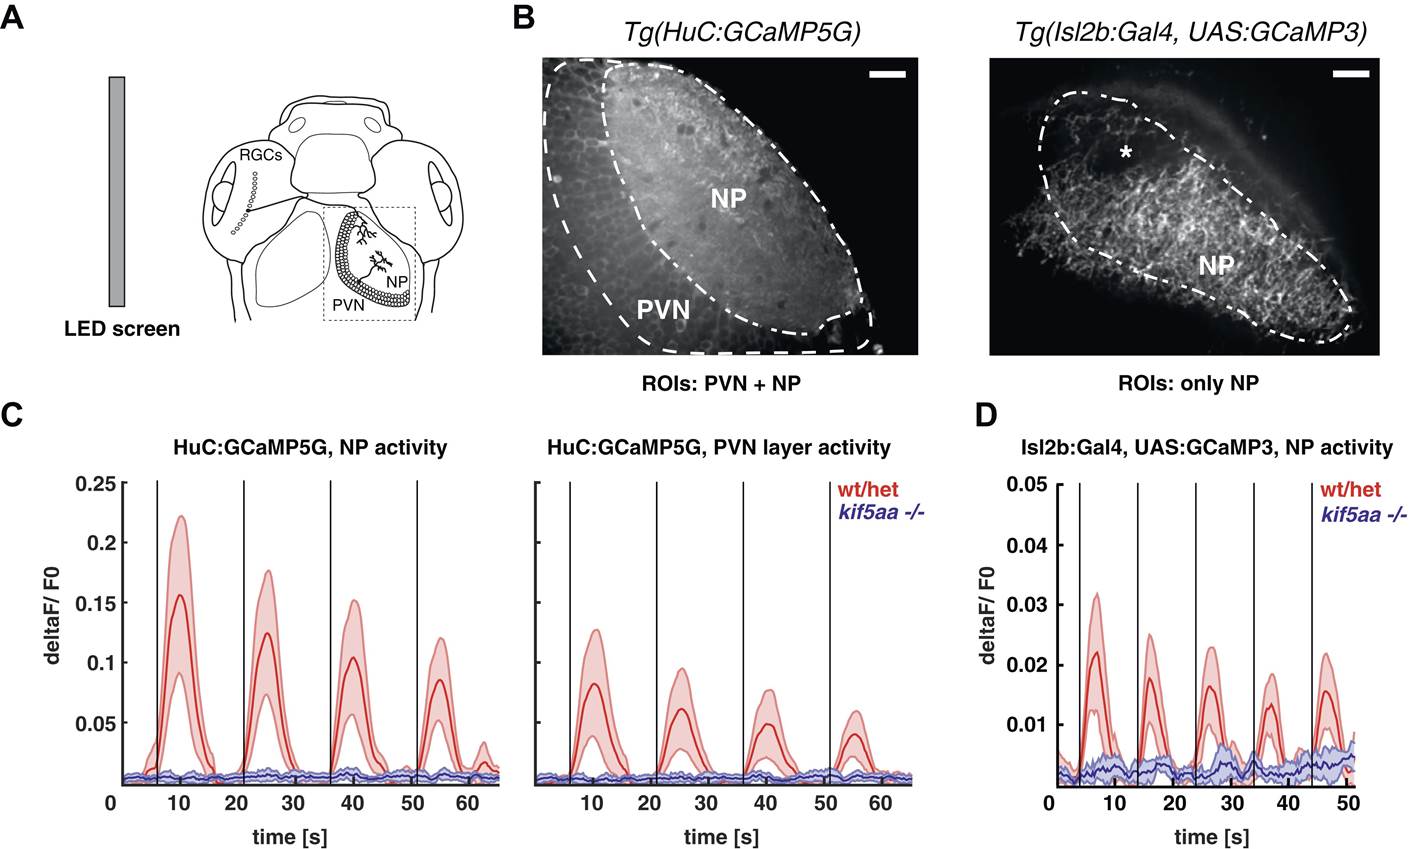
Fig. 4 Kif5aa mutant larvae show no activity in RGCs and no synaptic transmission to tectal cells.
(A) 5–7 dpf larvae were visually stimulated by bars on an LED screen running in caudal-to-rostral direction across the larva′s visual field. Wild-type and kif5aa mutant larvae expressing genetically encoded calcium indicators (GCaMPs) in different subsets of neurons of the visual system were confocally imaged in the tectum contralaterally to the stimulated eye (dashed box inset). RGCs = Retinal Ganglion Cells, PVNs = periventricular neurons, NP = neuropil. (B) The activity of visual system neurons in response to visual stimuli is shown as normalized GCaMP fluorescence intensity changes (deltaF/F0) over time. GCaMP intensity was averaged over manually determined regions of interest (ROIs) that corresponded to well-distinguishable anatomical regions in the larval tectum, the neuropil (NP) and the periventricular cell bodies area (PVNs). In Tg(HuC:GCaMP5) fish (left), GCaMP5 is expressed pan-neuronaly, that is, in both neuropil and PVNs, whereas in Tg(Isl2b:Gal4) × Tg(UAS:GCaMP3) fish (right), it is expressed in all RGCs and their processes. Scale bars = 20 µm. Asterisk = pigment cell in the skin. (C) Averaged deltaF/F0 ratio over time in response to a moving bar visual stimulation (black vertical line denotes the time point of the stimulus onset) in fish with pan-neuronal GCaMP5G expression. Four sequential rounds of stimulus presentation and the time-courses of Ca2+-transients in the neuropil ROIs (left panel) and periventricular cell bodies ROIs (right panel) of wild-type/heterozygous (red curve) and kif5aa mutant larvae (blue curve) (n = 7 each) are shown. Activity in the visual system of kif5aa mutants was almost absent between 5 and 7 dpf compared to wild-type larvae. Light red and blue zones indicate the 95% confidence intervals around the averaged deltaF/F0 curves for each region of interest (NP and PVN), respectively. (D) Averaged deltaF/F0 ratio over time in response to a moving bar visual stimulation (black vertical line denotes stimulus onset) in fish with GCaMP3 expression in RGC axons. Five sequential rounds of stimulus presentation and time-courses of Ca2+-transients in the neuropil of wild-type/heterozygous (red curve) and kif5aa mutant larvae (blue) (n = 9 each). RGC arbor activity in kif5aa mutants was strongly diminished. Light red and blue zones indicate the 95% confidence intervals around the averaged deltaF/F0 curves for the neuropil region of interest (NP).