
|
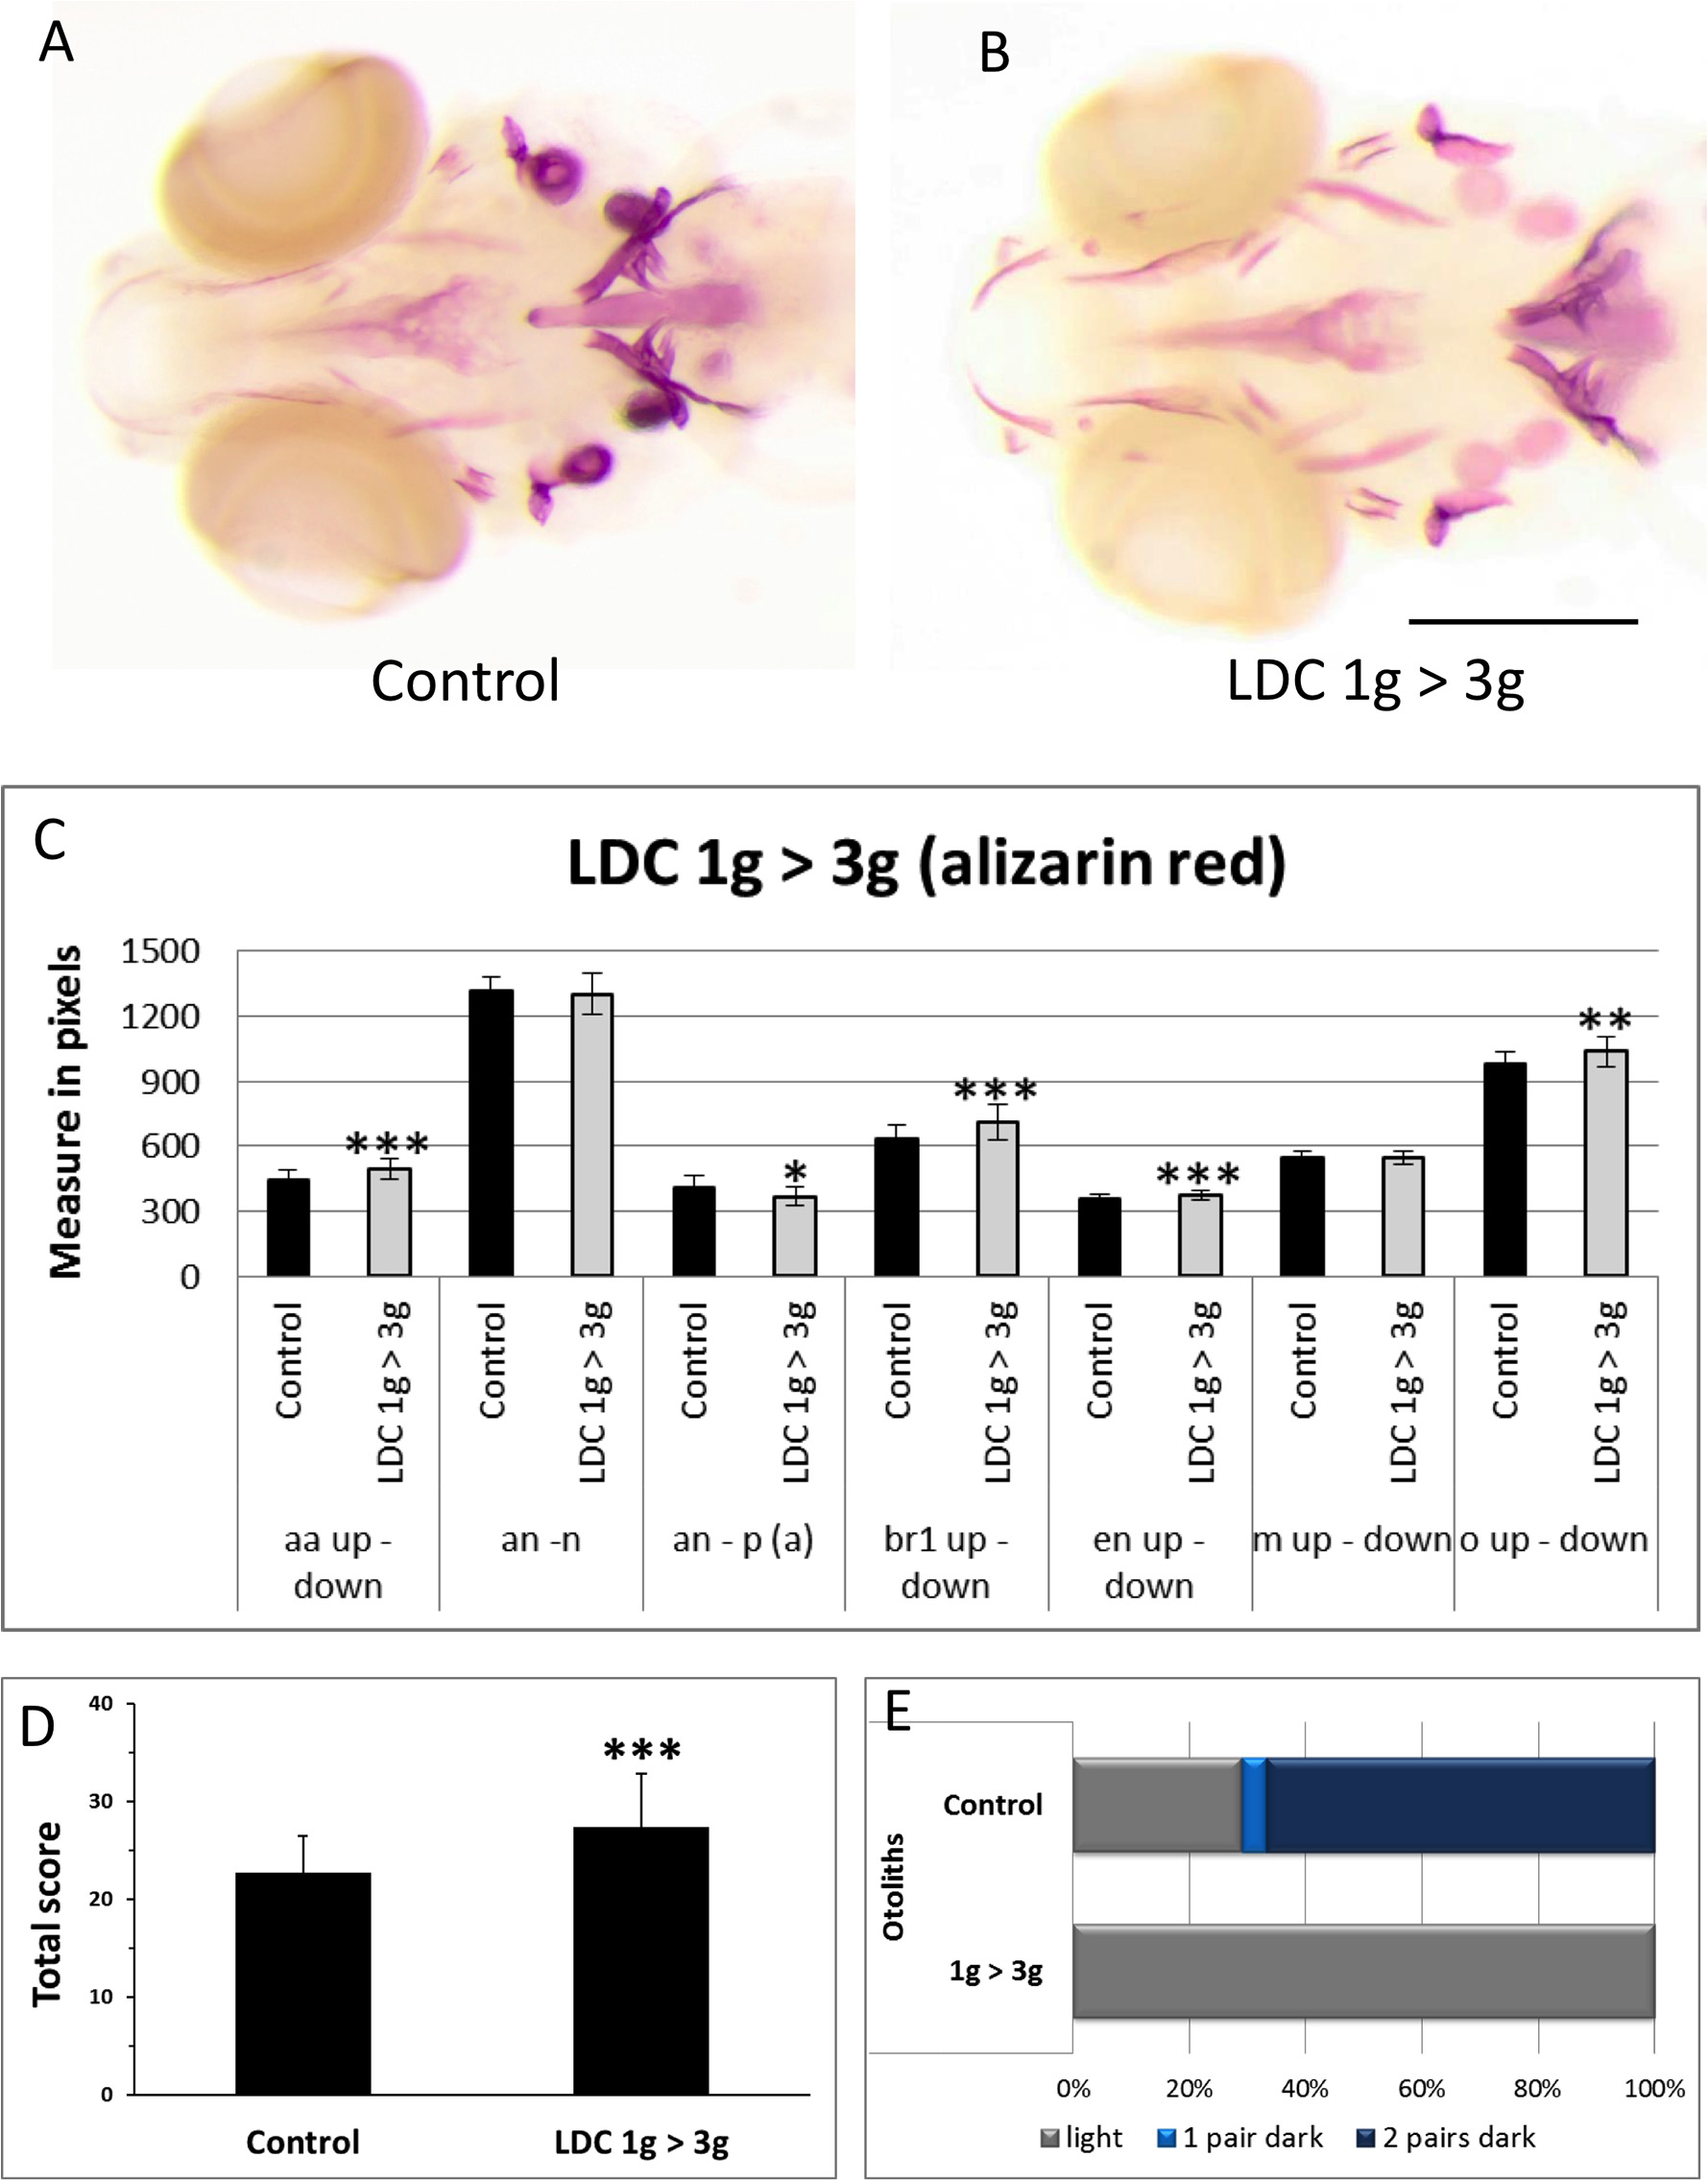
Fig. 7
Effect of 3g hypergravity between 5–9dpf on bone formation.
(A,B) Alizarin red staining of 9dpf control larvae (A) and larvae treated for 4 days in 3g hypergravity after 5 days at 1g (B). Ventral view, anterior to the left. (C) Comparison of morphometric measurements for some selected distances within the heads of control and 3g-treated larvae. Mean ± SD and t-test analysis were calculated for each measure on at least 20 individuals. * p < 0.05, ** p < 0.01 and ***p < 0.001. (D) Global score for bone formation in control and 3g treated larvae. (E) Comparison of cumulated frequencies of, respectively light, 1 pair dark or two pairs dark otoliths in control and 3g treated larvae. For abbreviations see legend to Fig 1.