
|
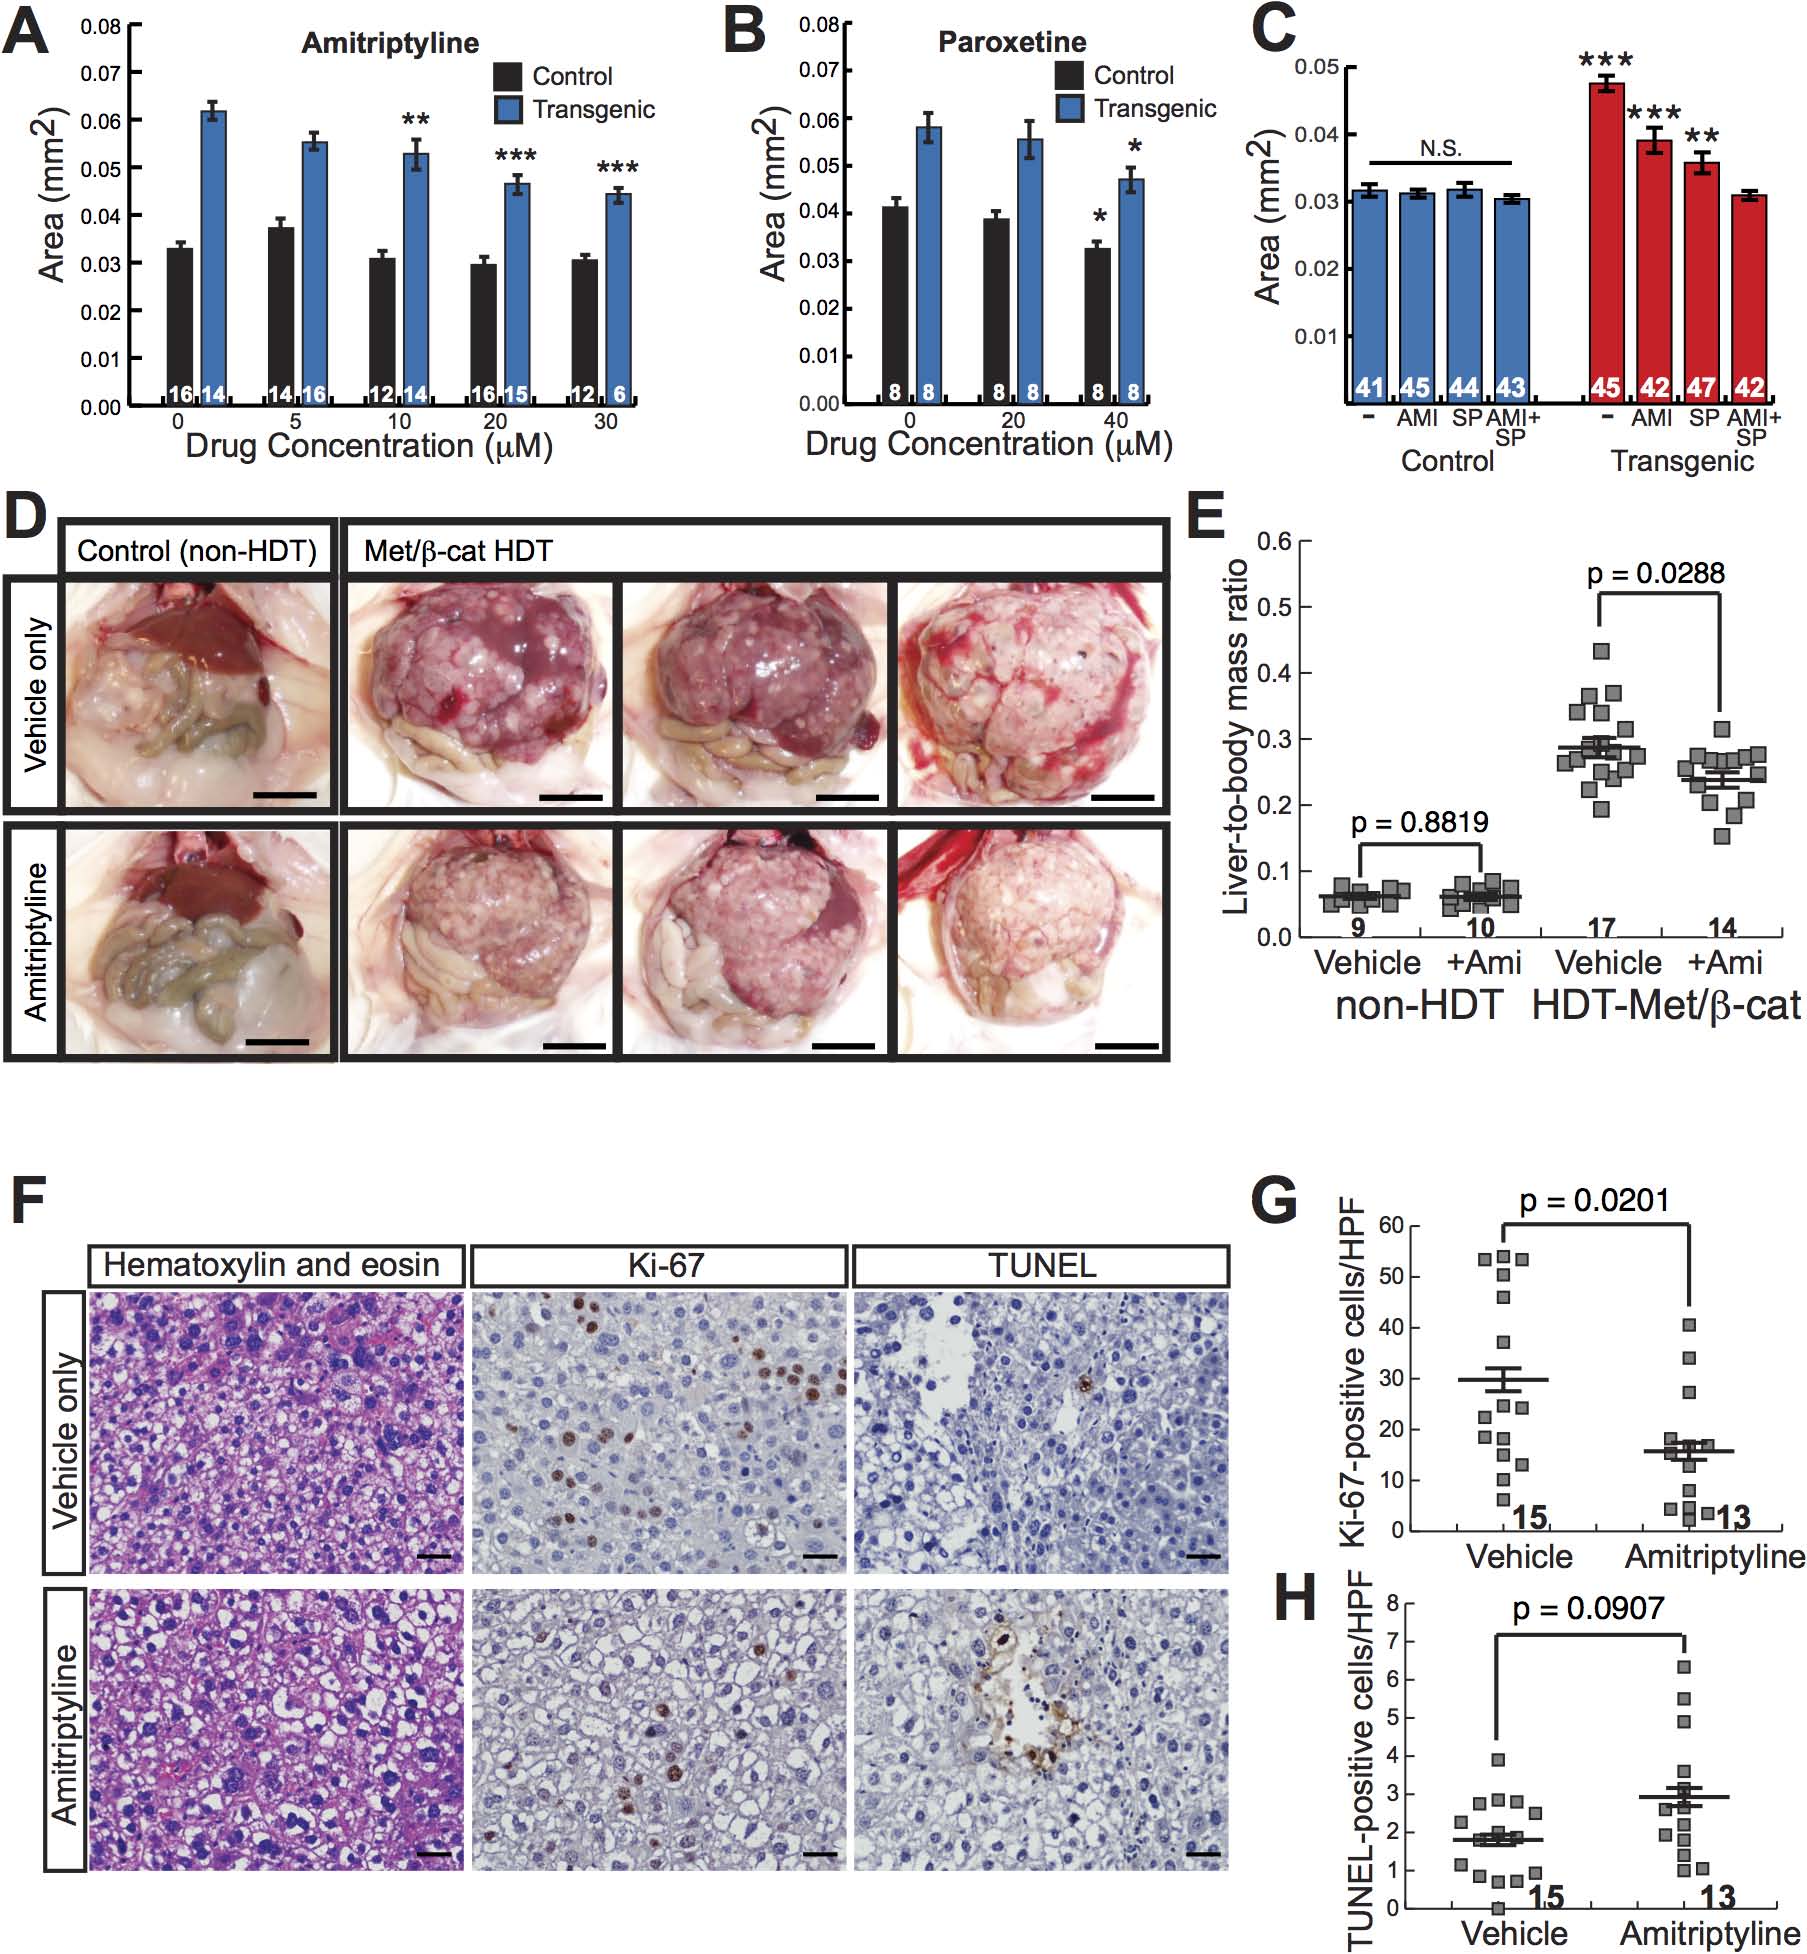
Fig. 6 Antidepressants decrease β-catenin-induced liver enlargement and tumorigenesis.
(A-B) Graphs showing mean liver size ± SEM of 6-day-old control sibling and transgenic zebrafish larvae treated for 3 days with amitriptyline (A) or paroxetine (B) at the indicated dosages. N values are shown above the x-axis. Asterisks indicate p-values for 2-way ANOVA comparing drug-treated zebrafish to DMSO-treated siblings with the same genotype: *, p<0.05; **, p<0.01; ***, p<0.001. (C) Graph showing mean liver size ± SEM of 6-day-old control sibling and transgenic zebrafish larvae treated for 3 days with 0.5% DMSO (-), 20 µM amitriptyline (AMI), 2 µM SP600125 (SP), or both drugs combined (AMI+SP). N values are shown above the x-axis. Asterisks indicate p-values for 2-way ANOVA comparing each group of transgenic zebrafish to AMI+SP group: **, p<0.01; ***, p<0.001. N.S., no significant difference between groups of non-transgenic zebrafish (2-way ANOVA). (D) Representative images of control, non-hydrodynamically transfected (non-HDT) mouse livers (left) and mouse liver tumors induced by hydrodynamic transfection of activated β-catenin and Met (Met/β-cat HDT). Mice were treated with saccharine alone (vehicle only, top row) or amitriptyline plus saccharine (bottom row). Scale bars, 1 cm. (E) Graph showing mean liver-to-body mass ratios ± SEM for non-HDT and HDT-Met/β-cat mice treated with saccharine alone (vehicle) or amitriptyline plus saccharine (+Ami). P values calculated with Mann-Whitney test. N values are shown above the x-axis. (F) Representative hematoxylin-and-eosin-stained, Ki-67-labeled, and TUNEL-labeled images from vehicle- and amitriptyline-treated mice. Ki-67 and TUNEL stainings were performed using 3, 3′-diaminobenzidine (DAB) substrate, so positive-staining cells are brown, and hematoxylin counterstain to highlight nuclei and other basophilic structures in blue. (G-H) Graphs showing mean ± SEM of Ki-67-positive (G) or TUNEL-positive (H) cells per high-power field. P values calculated with Mann-Whitney test. N values are shown above the x-axis.