
IMAGE
Fig. 4
- ID
- ZDB-IMAGE-150810-3
- Publication
- Evason et al., 2015 - Identification of Chemical Inhibitors of β-Catenin-Driven Liver Tumorigenesis in Zebrafish
- All Figures
- Figures for Evason et al., 2015
Image
|
Figure Caption
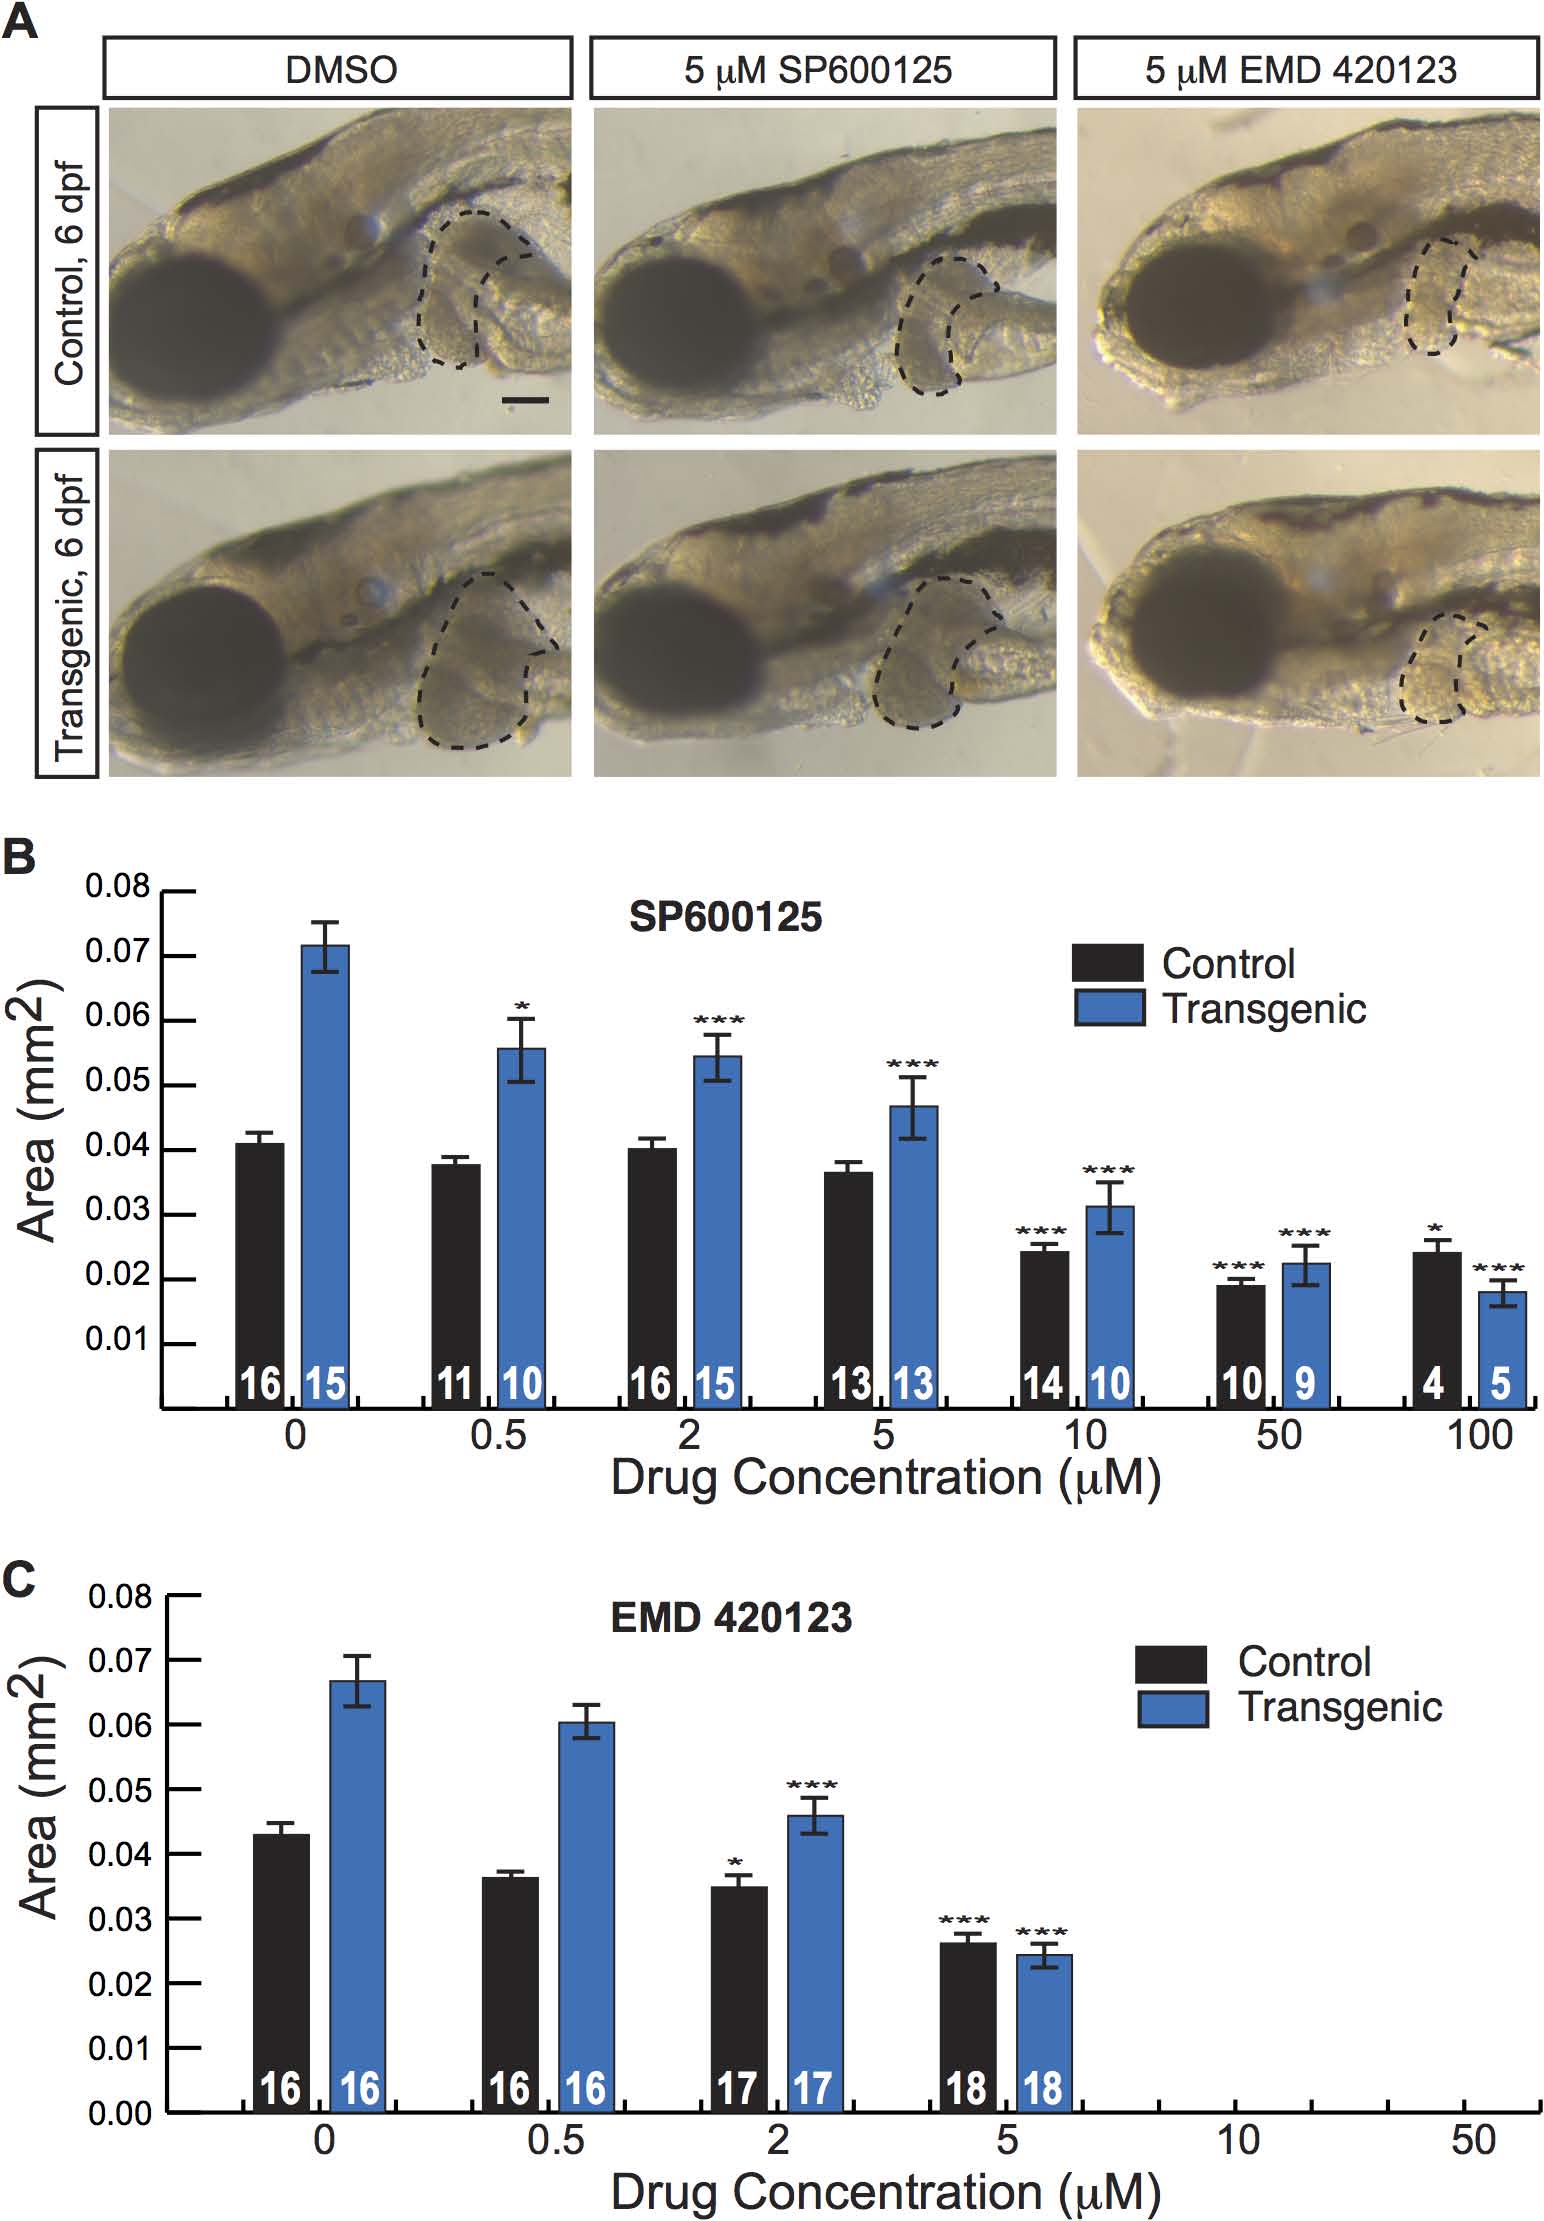
Fig. 4 JNK inhibitors suppress larval liver enlargement caused by activated β-catenin.
(A) Brightfield images of control sibling and transgenic 6-day-old fixed larvae, treated with DMSO or JNK inhibitors. Livers are outlined. Scale bar, 100 µm. (B-C) Graphs showing average liver size ± SEM of 6-day-old control sibling and transgenic larvae treated for 3 days with SP600125 (B) or EMD 420123 (C) at the indicated dosages. N values are shown above the x-axis. Asterisks indicate p-values for 2-way ANOVA comparing drug-treated zebrafish to DMSO-treated siblings with the same genotype: *, p<0.05; ***, p<0.001.
Figure Data
Acknowledgments
This image is the copyrighted work of the attributed author or publisher, and
ZFIN has permission only to display this image to its users.
Additional permissions should be obtained from the applicable author or publisher of the image.
Full text @ PLoS Genet.