
Image
|
Figure Caption
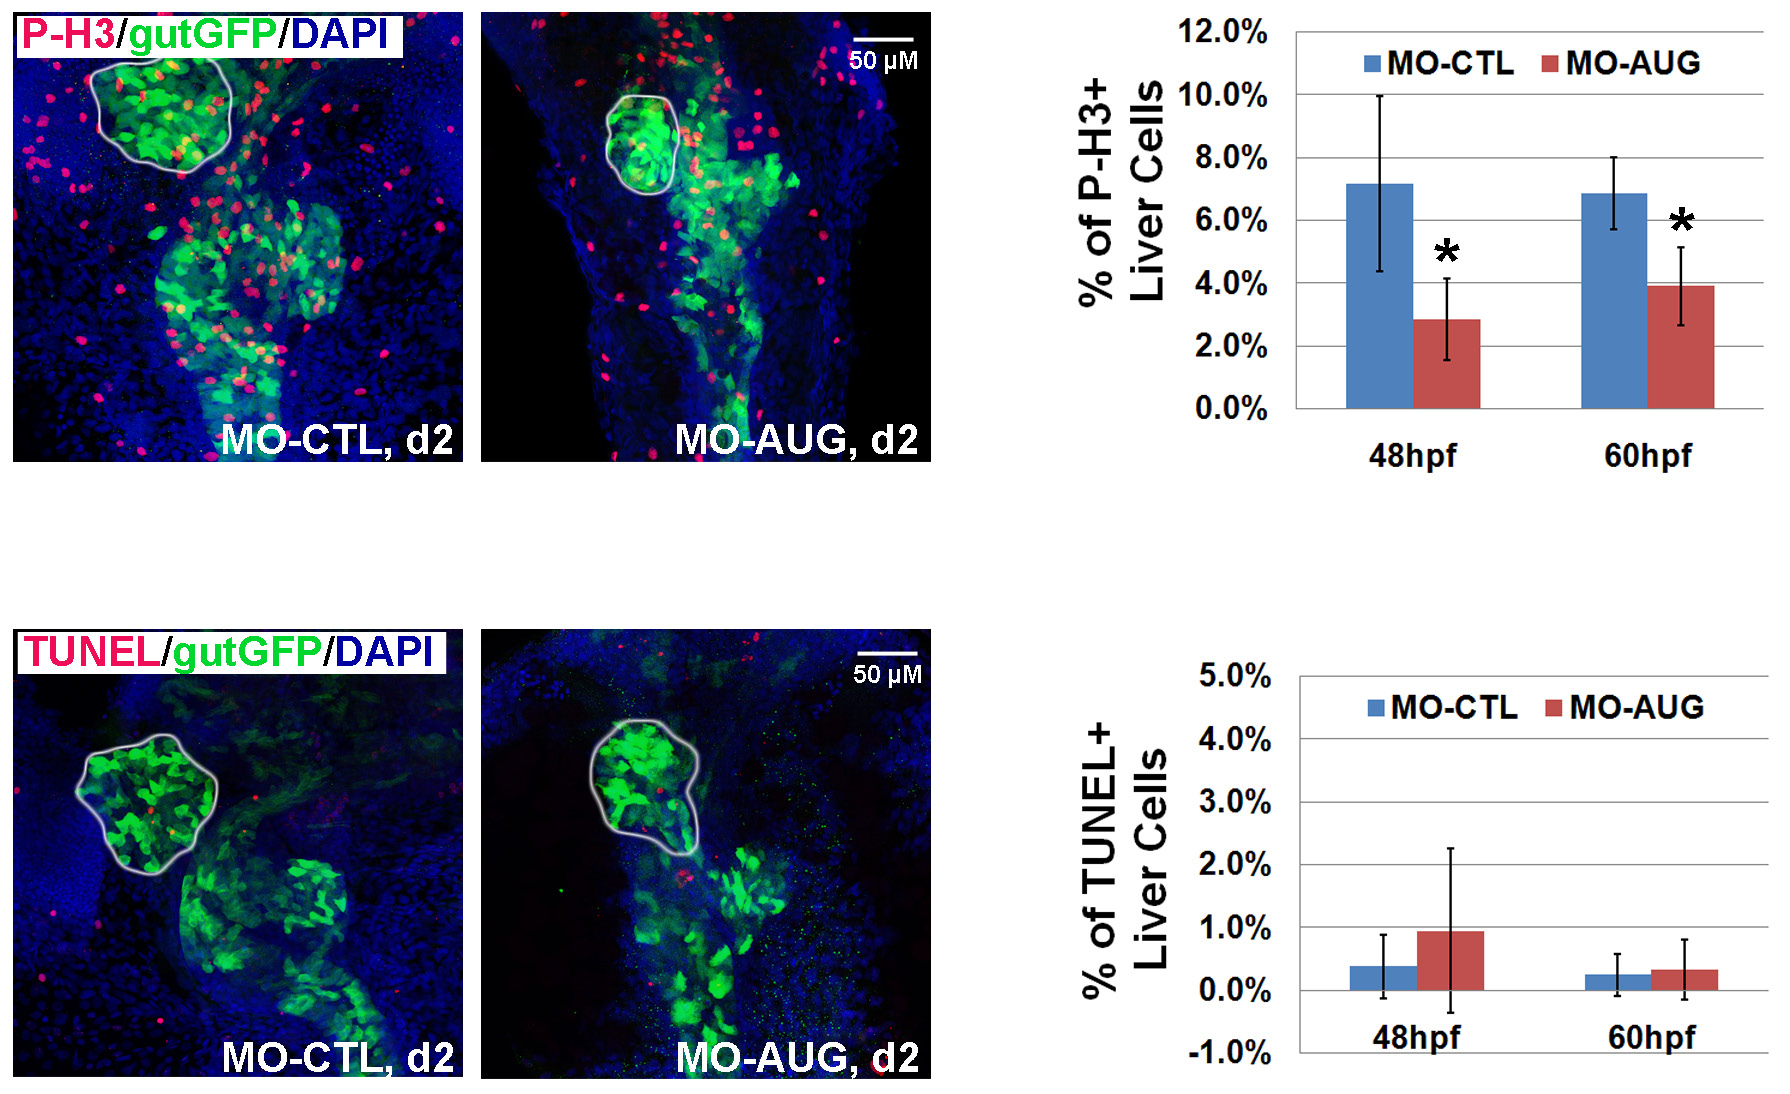
Fig. 4 Zfyve9a regulates the proliferation but not survival of hepatic cells. (A) Representative images of P-H3 staining of embryos at day 2. Green indicates the GFP-labeled endoderm cells. The outlined area is the liver. (B) Statistical results of the percentage of P-H3 positive hepatic cells in MO-CTL or MO-AUG injected embryos at 48 and 60 hpf. Stars indicates P<0.05 as analyzed by the t-test method. (C) Representative images of TUNEL assay at day 2. (D) The percentage of apoptotic hepatic cells in MO-CTL or MO-AUG treated embryos at 48 and 60 hpf. Error bars in (B) and (D) present the SD.
Figure Data
Acknowledgments
This image is the copyrighted work of the attributed author or publisher, and
ZFIN has permission only to display this image to its users.
Additional permissions should be obtained from the applicable author or publisher of the image.
Full text @ Int. J. Dev. Biol.