
Image
|
Figure Caption
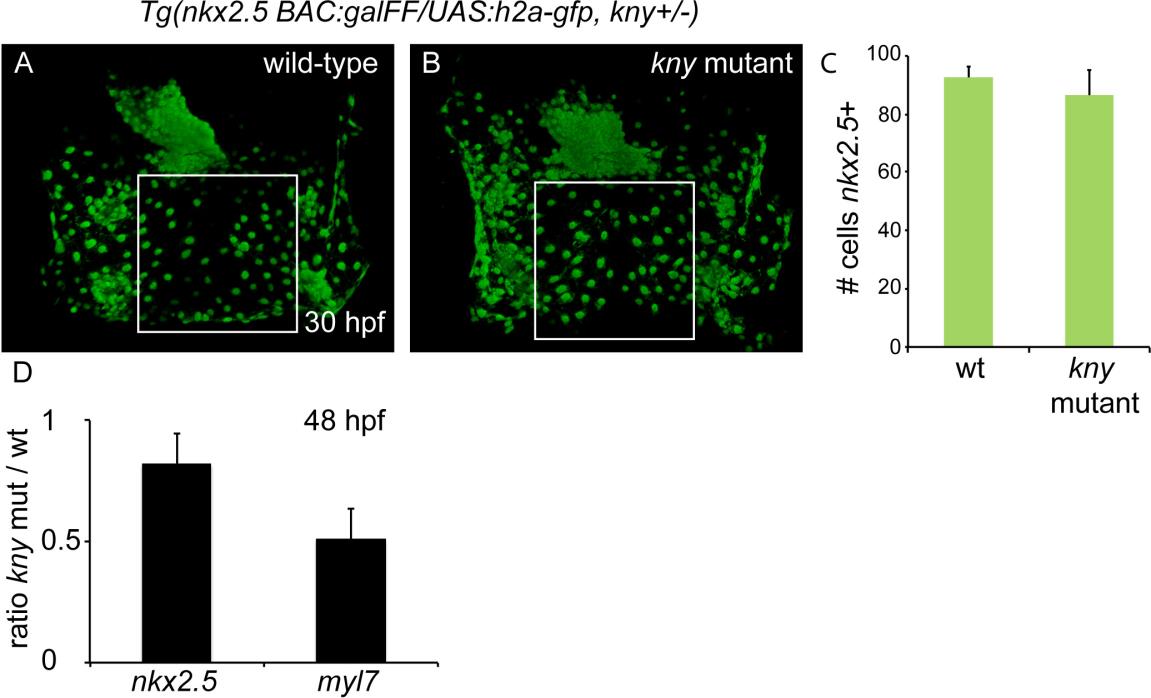
Fig. S6
Related to Figure 3: Nkx2.5+ cells in the anterior LPM of kny/gpc4 mutants and wild-type siblings (A,B) Dorsal view of wild-type (A) and kny/gpc4 mutant (B), expressing the nkx2.5:galFF/UAS:h2a-gfp transgene at 30 hpf. (C) Numbers of nkx2.5+ cells in boxed areas from (A,B). (D) qPCR results of nkx2.5 and myl7 expression levels at 48 hpf. Normalization against ef1a. The y-axis represents the ratio of expression level between kny/gpc4 mutants and wild-type siblings (three biological repeats). Results are represented as mean±s.e.m.
Acknowledgments
This image is the copyrighted work of the attributed author or publisher, and
ZFIN has permission only to display this image to its users.
Additional permissions should be obtained from the applicable author or publisher of the image.
Full text @ Development