
|
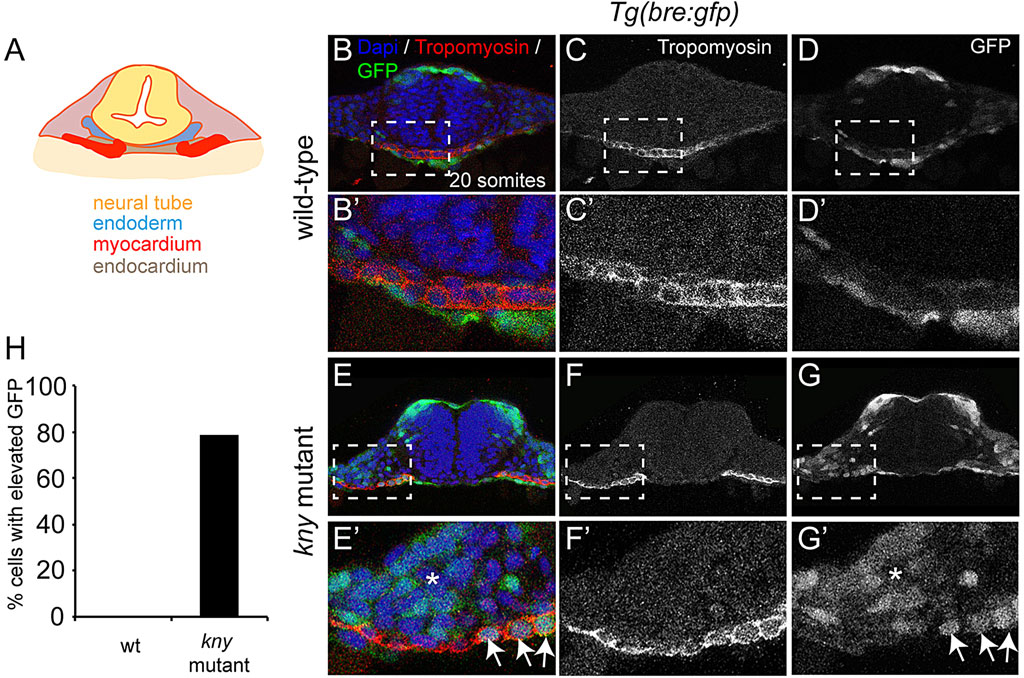
Fig. 4
Elevated Bmp signaling in kny/gpc4 mutants. (A) Schematic cross-section through the anterior LPM of a 20-somite stage embryo. (B-G′) Cross-sections of WT (B-D′) or kny/gpc4 mutant (E-G′) embryos with Tg(bre:gfp). Cell nuclei are shown in blue (DAPI), cardiac tissue in red (tropomyosin) and Bmp activity in green (bre:gfp transgene). B′-D′ and E′-G′ are higher magnification views of boxed areas in B-D and E-G, respectively. Arrows indicate GFP+ cardiomyocytes. Asterisks indicate lateral plate mesoderm with GFP+ cells. (H) Percentage of cardiomyocytes in kny/gpc4 mutants with higher GFP pixel intensity than the 1.5-fold average value for wild-type cardiomyocytes (n=2, 14 cells).